Analysis Tab Overview
- Print
- DarkLight
Analysis Tab Overview
- Print
- DarkLight
Article summary
Did you find this summary helpful?
Thank you for your feedback
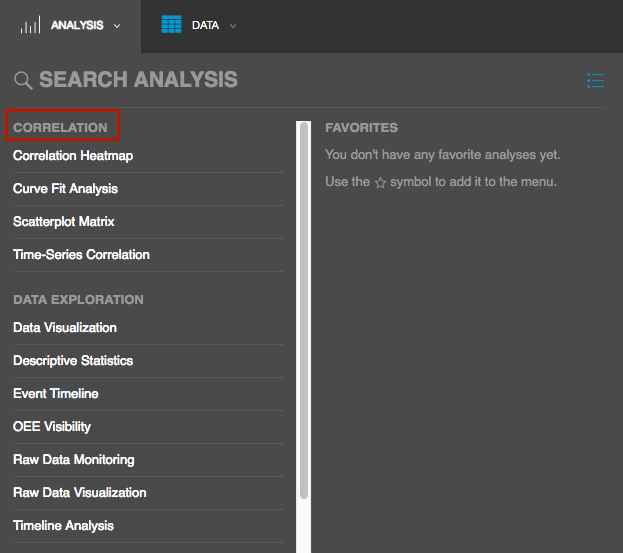
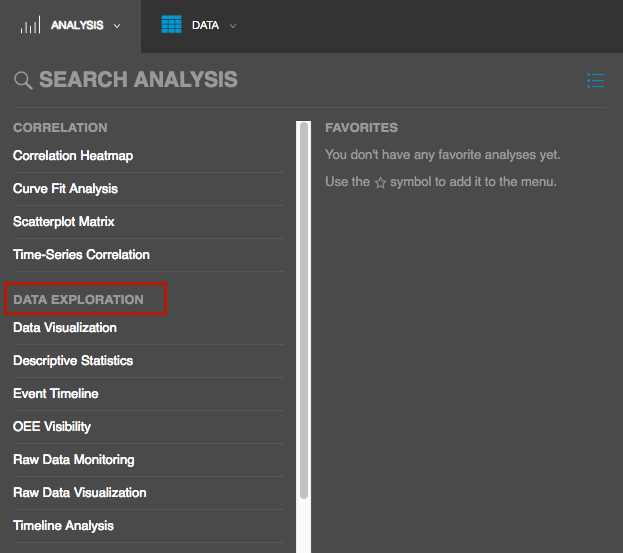
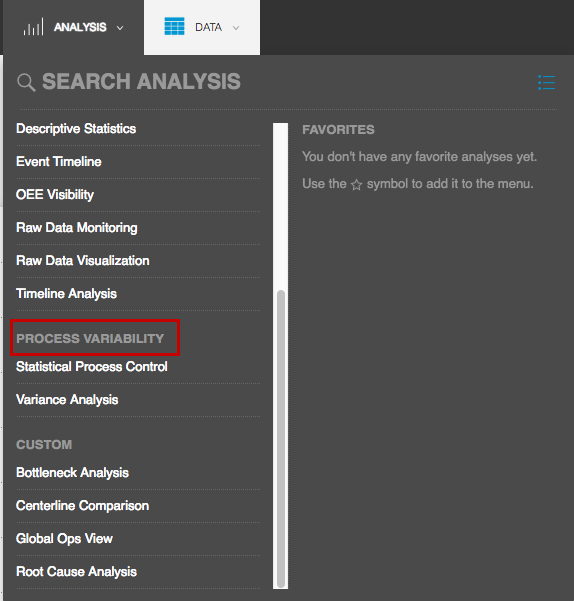
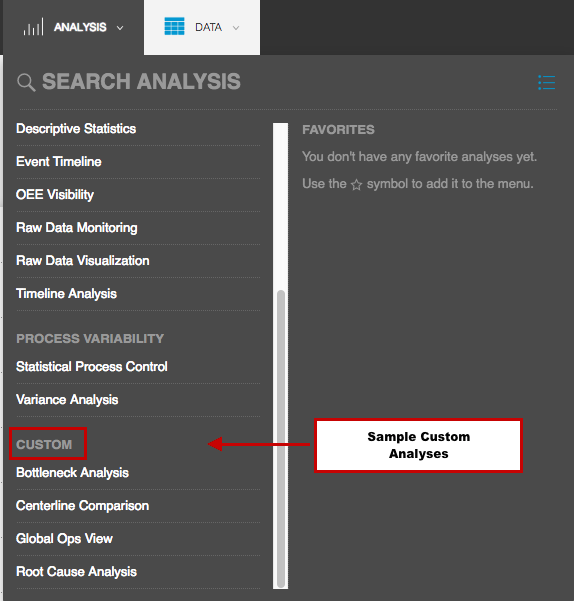
The Analysis tab contains tools to visualize contextualized data, as well as analytics that allow for deeper introspection into that data. There are four categories of data tools:
- Correlation
- Data Exploration
- Process Variability
- Custom
Correlation Options

| Option | Description |
| Correlation Heatmap | Investigate pairwise relationships between multiple fields. |
| Curve Fit Analysis | Gain an in-depth understanding of the relationship between a pair of fields. |
| Scatterplot Matrix | Investigate pairwise relationships in more depth than the Correlation Heatmap. |
| Time-Series Correlation | Understand which fields have the highest correlation to a field of interest. |
Data Exploration Options

| Option | Description |
| Data Visualization | Create robust visualizations leveraging contextualized data models. |
| Descriptive Statistics | Perform an in-depth analysis of any given field. |
| Event Timeline | Understand the duration and sequence of events over time, shown by category or type. |
| OEE Visibility | Monitor and visualize key performance indicators (KPIs) such as performance, availability, OEE, and defects. |
| Raw Data Monitoring | View time-series data in real time as it flows from your facility to the Sight Machine platform. |
| Raw Data Visualization | Create visualizations of the raw data streaming into the Sight Machine platform. |
| Timeline Analysis | View the sequence of process data, downtimes, and defects over time. |
Process Variability Options

| Option | Description |
| Statistical Process Control | Monitor stability and initiate alerts when any parameters go out of control to ensure the quality and stability of your manufacturing process. |
| Variance Analysis | Surface the fields involved in the production process that have high variance and which may be impacting quality and efficiency. |
Custom Analysis Options

The Analysis tab also contains any enhanced or custom analytics created by your organization leveraging the Sight Machine SDK or developed by the Sight Machine services team.

