Content Impact Report
The Content Impact Report provides information about content that may break or encounter errors due to recent changes made to your Workspace. Workspace changes could involve the renaming or removal of a Machine Type, a Machine, or Data fields including KPIs and runtime fields, and affect user-generated content such as Dashboards and Data Tables.
Accessing and Viewing the Report
To access the Content Impact Report, navigate to your current workspace in Factory BUILD and click on the overflow menu (represented by the three vertical dots), and select Error Report.
.gif)
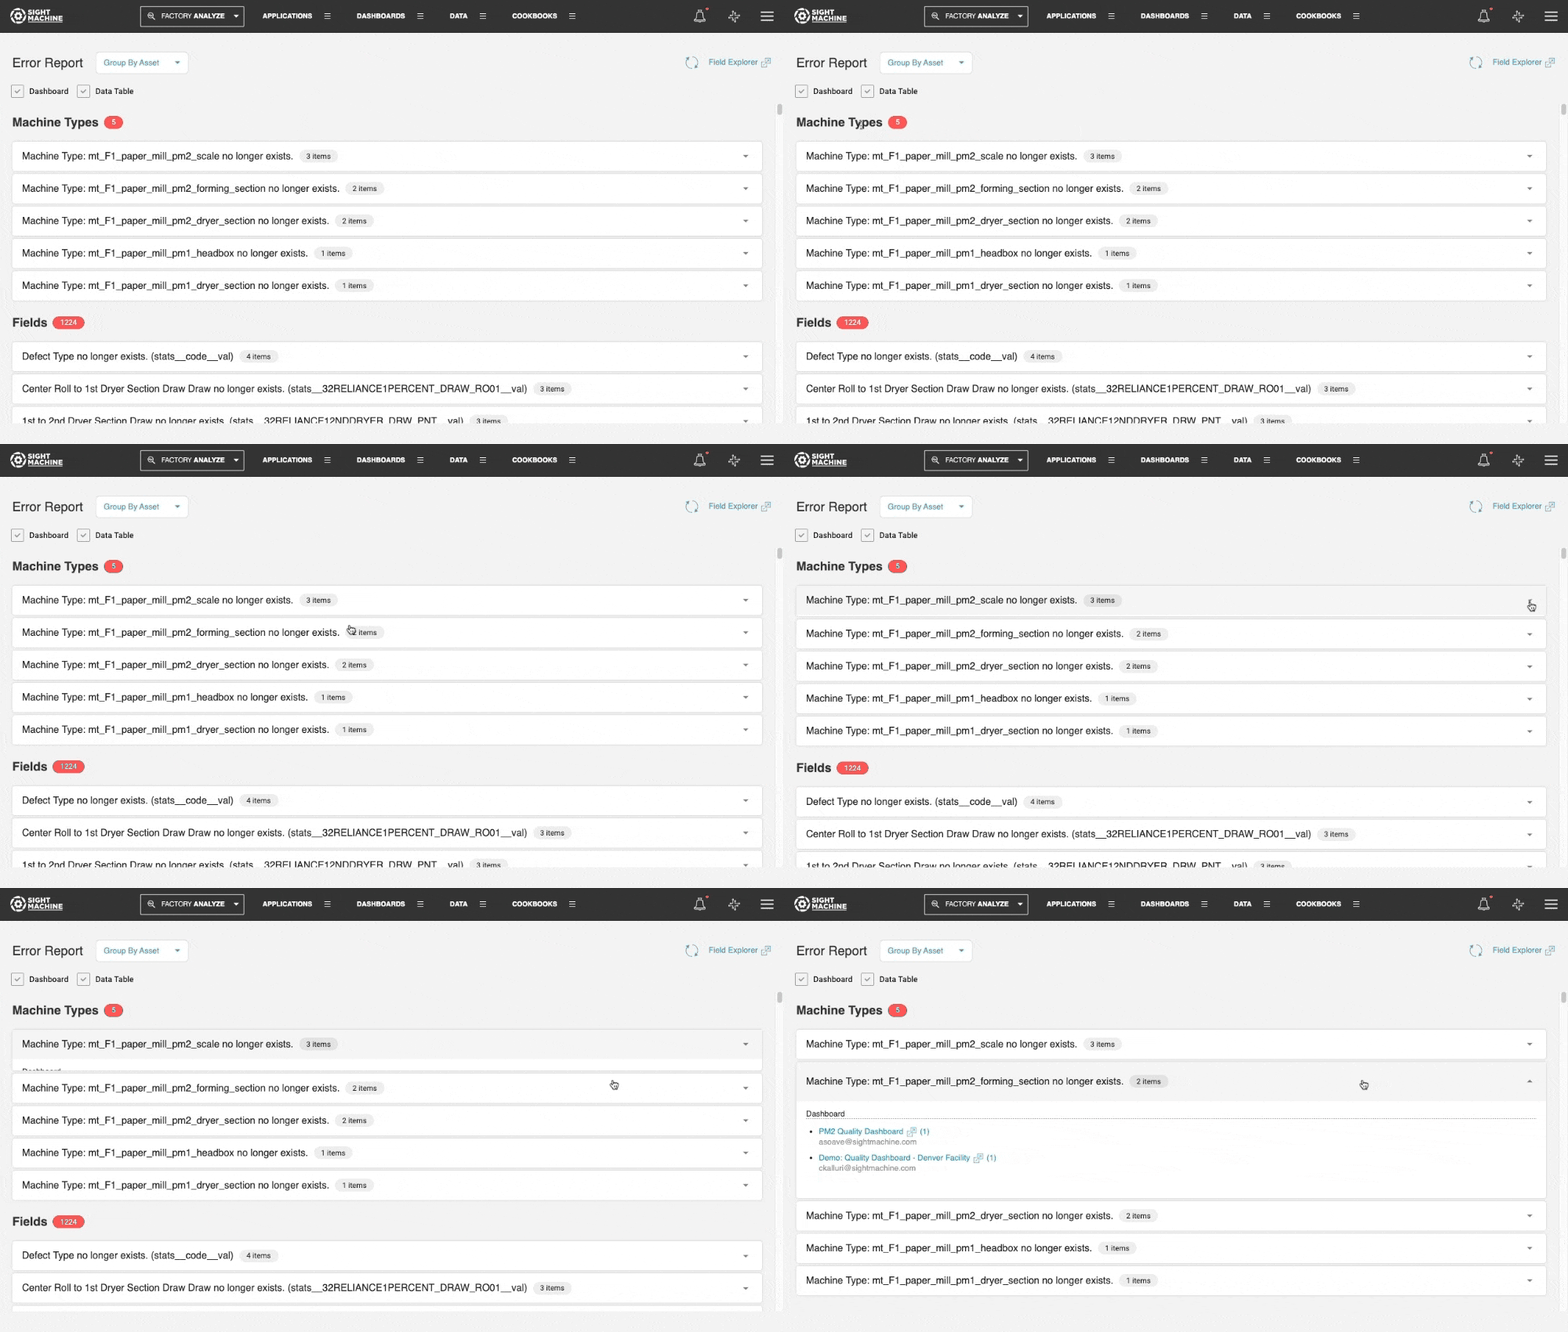
This report provides a list of all the Machine Types, Machines, and Data fields that are no longer available. For each of these invalid values, you can view the specific content that is negatively impacted as a result of missing or invalid data.

In this example, you can see that the Missing Machine Type
mt_F1_Paper_mill_pm2_scaleaffects 2 Dashboards and 1 Data Table. You can navigate to this content directly from this report, and update it to resolve any issues. For Dashboards, you can also see the specific widgets affected, by hovering over the Dashboard name..gif)
You can view the report based on the issue type (e.g. Machine changes) using the Group by Asset option, which is the default.
To view a list of issues by content type, you can select the Group by Content option. In this view, you can see a list of all the Dashboards and Data Tables affected. When you click on a specific Dashboard, for example, you can see not only the names of the fields that are missing, but also whether that field was selected on the Y-Axis, the X-Axis, the Compare By, or the filter picker. This enables you to identify issues immediately and resolve them in a timely manner.
.gif)
Dashboard Widget Error Details
Once you navigate to the affected Dashboard, you can see erroneous widgets immediately and obtain information on the cause of the errors. For example, when you access the PM2 Quality Dashboard , you can see 2 widgets with errors. Click on See Widget Errors for more details.
.gif)
Report Options
Filter Content Type: You can filter the report to only display certain types of affected content. For example, if you only want to surface Dashboards, you can uncheck the Data Table option at the top of the report.
Reload option: As you start resolving issues in affected content, you can use the Reload button at the top right to verify that the corrected content no longer appears in this report.
You can also access the Field Explorer directly from the Content Impact Report, for an overview of available data fields.
Feature Benefits
Proactive Error Identification: Automatically detects and lists content—such as Dashboards and Data Tables—that may break due to renamed or removed Machine Types, Machines, or Data fields (KPIs and runtime fields).
Bidirectional Traceability: Offers two distinct perspectives for analysis: Group by Asset (showing which invalid values affect specific content) and Group by Content (showing specific dashboard widgets or table columns impacted by missing data).
Deep-Link Resolution: Enables immediate action by allowing users to navigate directly from the error report to the affected content, significantly reducing the time required to repair broken visualizations.
Granular Widget Diagnostics: Provides precise details on why a dashboard widget is failing by identifying exactly which field is missing and where it was utilized (e.g., X-Axis, Y-Axis, Compare By, or Filter Picker).
Live Validation and Exploration: Features a Reload option to verify fixes in real-time and provides direct access to the Field Explorer, ensuring users can quickly find valid replacement fields for broken content.
Summary
The Content Impact Report acts as a safeguard for your organization's user-generated content, specifically targeting errors caused by Workspace modifications in Factory BUILD. By surfacing "orphaned" content that relies on missing or renamed assets, the report prevents data siloing and visualization downtime.
Accessed via the Error Report option in the Workspace overflow menu, the tool provides a clear roadmap for maintenance. Whether you are filtering by content type or drilling down into specific widget error details, the report ensures that any changes to your data model are reflected accurately across all Dashboards and Data Tables, maintaining a single version of truth for your manufacturing operations.