Customizing the Raw Data Visualization
- Print
- DarkLight
Customizing the Raw Data Visualization
- Print
- DarkLight
Article summary
Did you find this summary helpful?
Thank you for your feedback
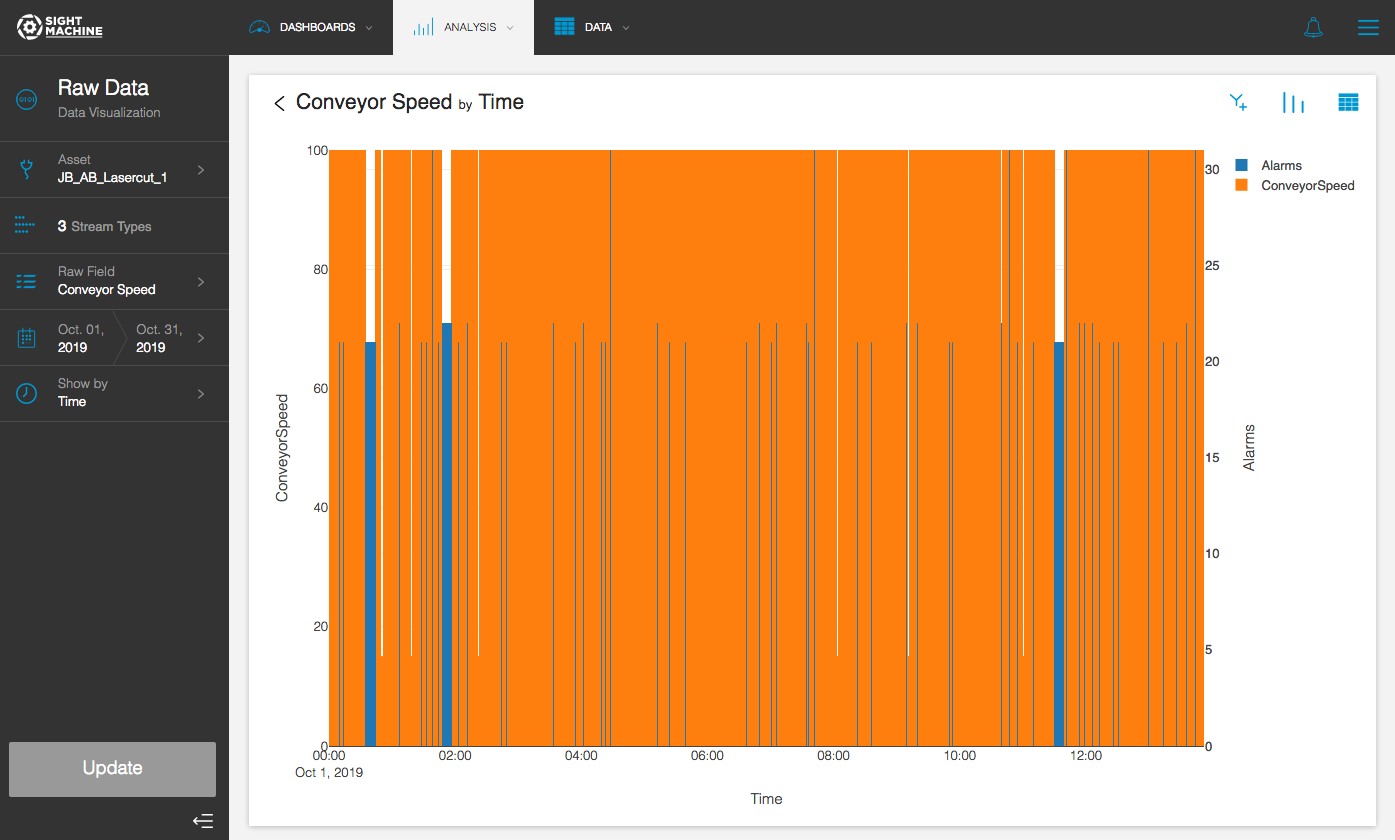
After you visualize your raw data, you can make customizations to it using the toolbar.
To customize the Raw Data Visualization:
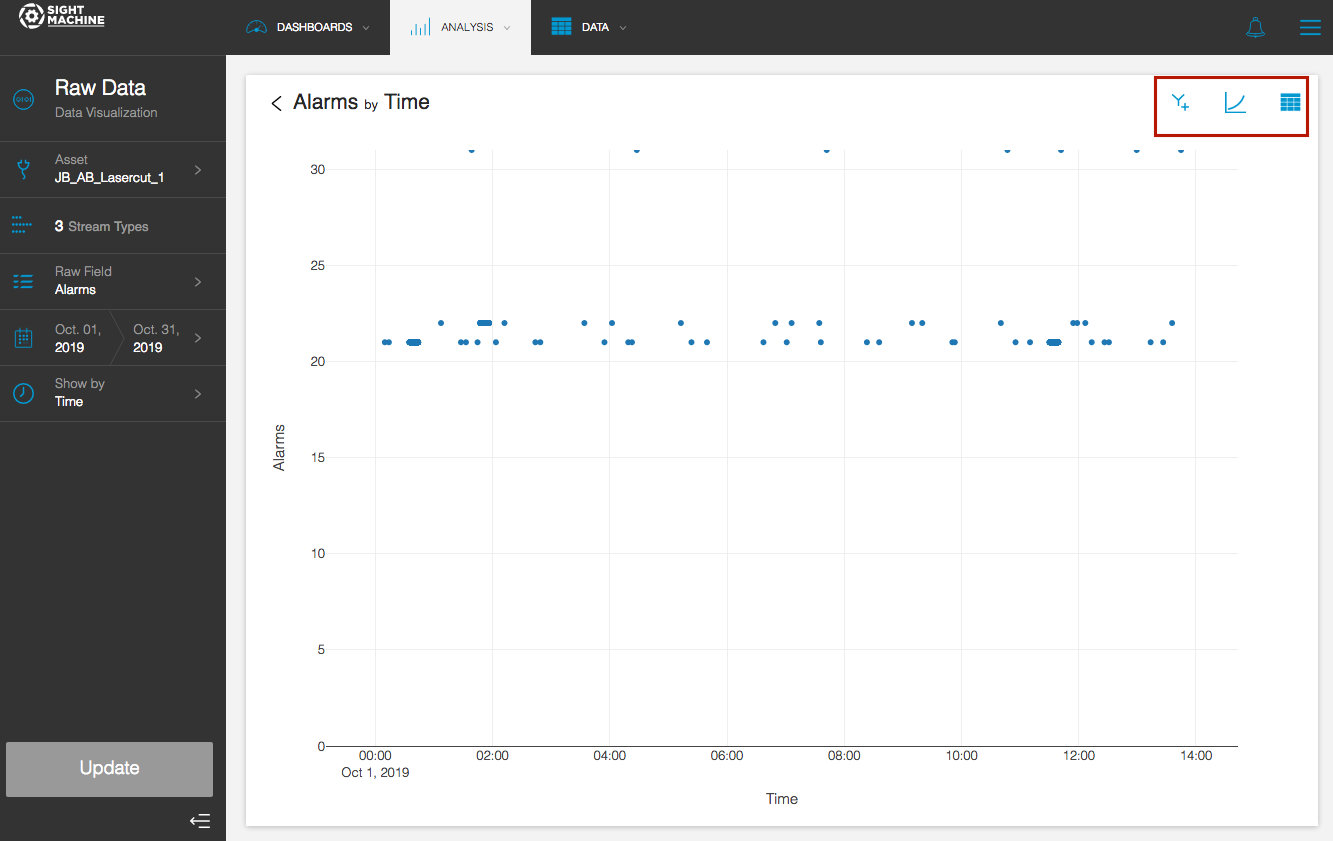
- On the Raw Data Visualization screen, you can show a secondary Y axis on the chart. In the toolbar in the upper-right, click the Y+ button.
- In the Secondary Y Axes window, make a field selection.
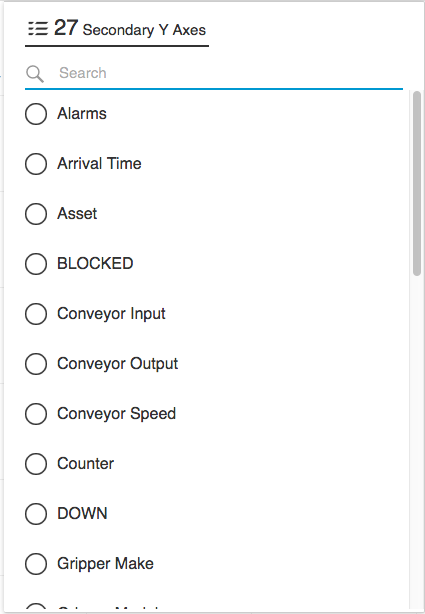
- Click Update. The chart now displays two color-coded fields.
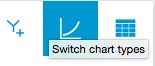
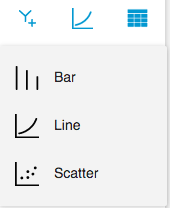
- To change the type of chart, in the toolbar, click the chart type button.
- Select one of the following options:
- Bar
- Line
- Scatter
- To view the chart as an exportable table, in the toolbar, click the table view button.