Formatting Options for Dashboards
- Print
- DarkLight
Formatting Options for Dashboards
- Print
- DarkLight
Article summary
Did you find this summary helpful?
Thank you for your feedback
Dashboards are often displayed on the Plant Floor for Operations teams, and need to be customized to improve readability.
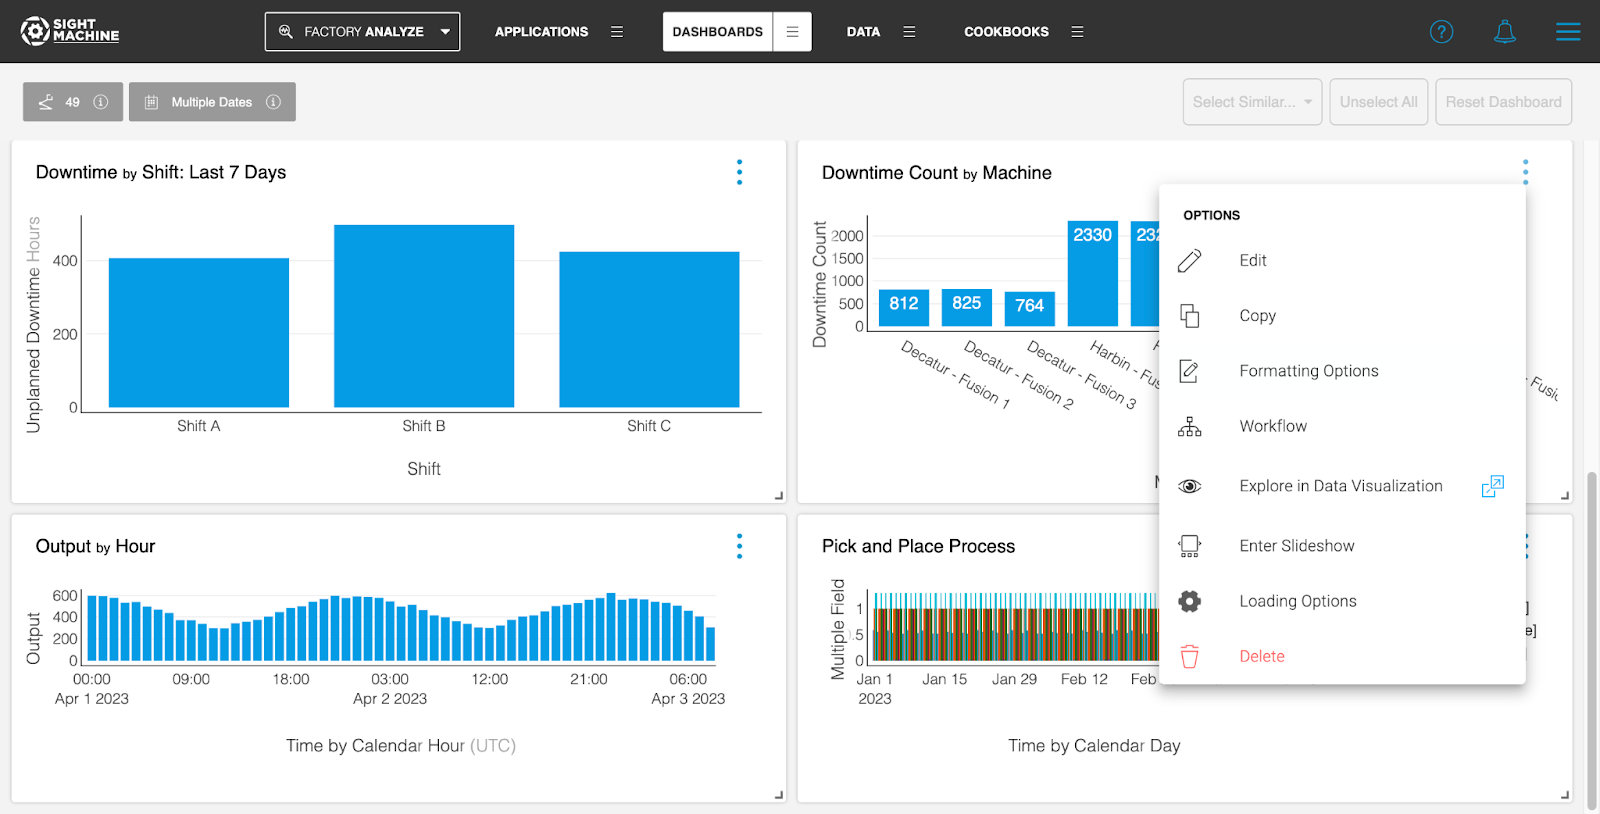
All Applications now have Formatting Options available from the overflow menu on Dashboard. To access these options, including the ability to hide and modify the font size of widget titles for improved readability, go to the overflow menu and click on Formatting Options.
The list of supported Applications consists of Data Visualization, Time Series Correlation, Correlation Heatmap, Curve Fit Analysis, Statistical Process Control, Descriptive Statistics, Variance Analysis, Timeline Analysis, and Event Timeline.
Single Value Widgets and Notepad Widgets also offer Formatting Options.
Options common to all Applications and widgets include the ability to Show or Hide the Header, and modify the font size of the Header.
Data Visualization
Data Visualization widgets can now be customized for improved readability via the new Formatting Options menu.
The Formatting Options enable users to modify the font size for the widget title, axis labels and tick labels for X and Y axes, and legend.

Each of the above chart elements can be set to be displayed or hidden on the chart as well.

The Formatting menu can be moved across the screen to enable convenient editing.
Data Visualization chart values can be set to always display on Bar Charts, Grouped Bar and Stacked Bar. Additionally, data label font sizes can also be modified.
NOTE: Please note that data labels may not display well for charts with a large number of data points, and can be hidden using the Formatting Options menu.

Chart margins can be adjusted for further customization by turning off the “Auto Margin” toggle.

Single Value Widgets
Single Value Widgets have several options that enable you to control font size, text alignment within the widget, and the number of decimal values displayed.
Units of measure, if configured, are displayed by default but can be turned off. To turn off units, click on Formatting Options and toggle off “Display Units”.
You can also specify a number separator (1000’s separator) for numerical data displayed in Single Value Widgets. To specify this option, click on the Formatting Options menu in the overflow menu of the Single Value Widget and select the checkbox for “Include Number Separators”.

Additional formatting options vary by Application, as shown below for the Time-Series Correlation and Statistical Process Control applications.
Formatting options for Time-Series Correlation
Formatting options for Statistical Process Control