Overview
Data Preview is a feature designed for validating data quality faster by offering streaming data previews. It allows users to quickly get an initial result set while the full preview is still processing.
When analyzing data in the Pipeline Builder, two distinct filtering methods are available: the Preview Filter (applied before processing) and the Column Filter (applied to the results table). The key difference lies in when the filter is applied, which dictates whether you are optimizing performance (Preview Filter) or refining analysis (Column Filter).
Before You Begin
Preview Filter: Pre-Processing
Performance: Reduce the amount of data processed and transferred.
Column Filter: Post-Processing:
Analysis: Refine the view of the available data set for inspection.
To initiate a Preview Filter, you must access the "Configure Preview" settings after selecting the operator port. For a Column Filter, you select the filter icon on the column header within the results table.
Workflow
This workflow is used when you know you only need a subset of the data (e.g., a specific device ID or a date range) to validate the operator logic, allowing you to process less data.
Step 1: Initiate Preview by selecting the operator port.
(1).gif)
Step 2: Select "Configure Preview".
(1).gif)
Step 3: Preview results load iteratively, providing an initial, quick glimpse automatically; you can select "Update Results" anytime to view the most current data, and a final "Update Results" selection displays the complete data once the preview complete status is shown.
.gif)
Result: Only the data meeting the filter criteria is processed and streamed to the results table, leading to a faster load time
Column Filter Workflow (Analysis Focus)
This workflow is used after data has been loaded to visually isolate specific records for inspection, or if you didn't know the exact filtering criteria beforehand.
Step 1: Initiate Preview without a Preview Filter (or with a broad one).
.gif)
Step 2: In the results table, select the filter icon on a column header
.gif)
Result: All data was processed, but only the filtered rows are displayed in the table view, facilitating focused analysis.
Preview Results
The preview result set offers several options to manipulate and filter preview results in a table format.
Preview Result Total: The number of “Records Processed” are available as part of the result header. This count is specific to each individual operator in the preview path and based on when results were last updated.
.png "image(72).png")
Preview Column Statistics: To quickly identify columns with potential data issues, each column includes statistics including % NULL and, for continuous data fields, MIN and MAX values. You can easily find occurrences of each by selecting the chip, and scrolling forward or backward to the next instance.
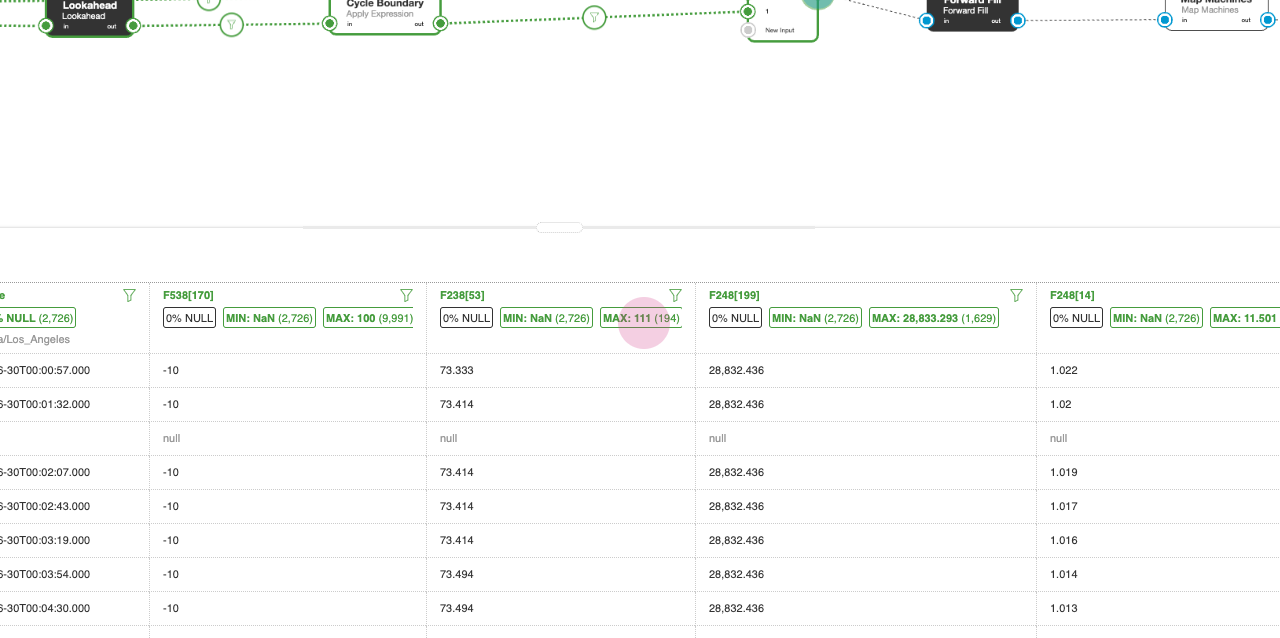
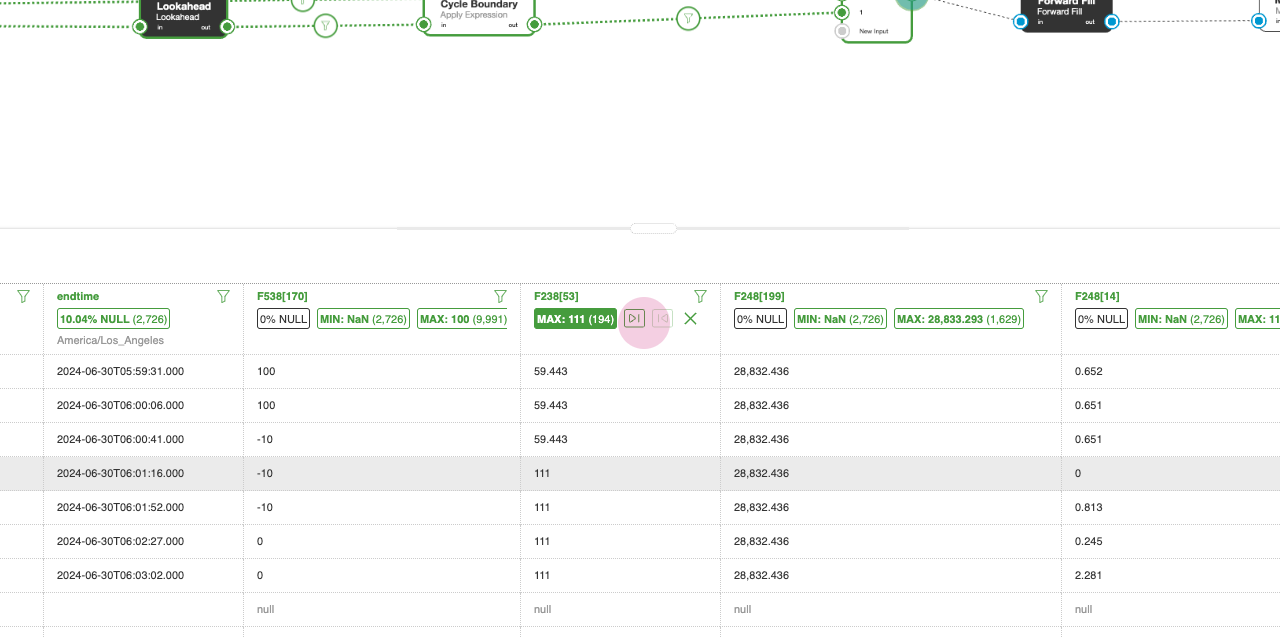
NOTE:
Preview statistics are based on the result set after filters are applied and re-run as filters are updated.
Column Sort: Once the preview is complete or ha been canceled, you can sort individual columns by selecting the column name. The first selection will sort in decending order. Selecting the column again will sort in ascending order. Selecting the column a third time will remove the sort.
.png "image(75).png")
NOTE:
Sort is only available once the preview is complete or has been canceled. Additionally, when the sort is run, all of the available data will be retrieved, updating the column statistic.
Expand Preview Panel Height: To expand or reduce the height of the preview table, drag the table and it will resize vertically.
.png "image(73).png")
Adjust Selected Columns: You can adjust the visible columns by either adding/ removing columns or re-ordering.
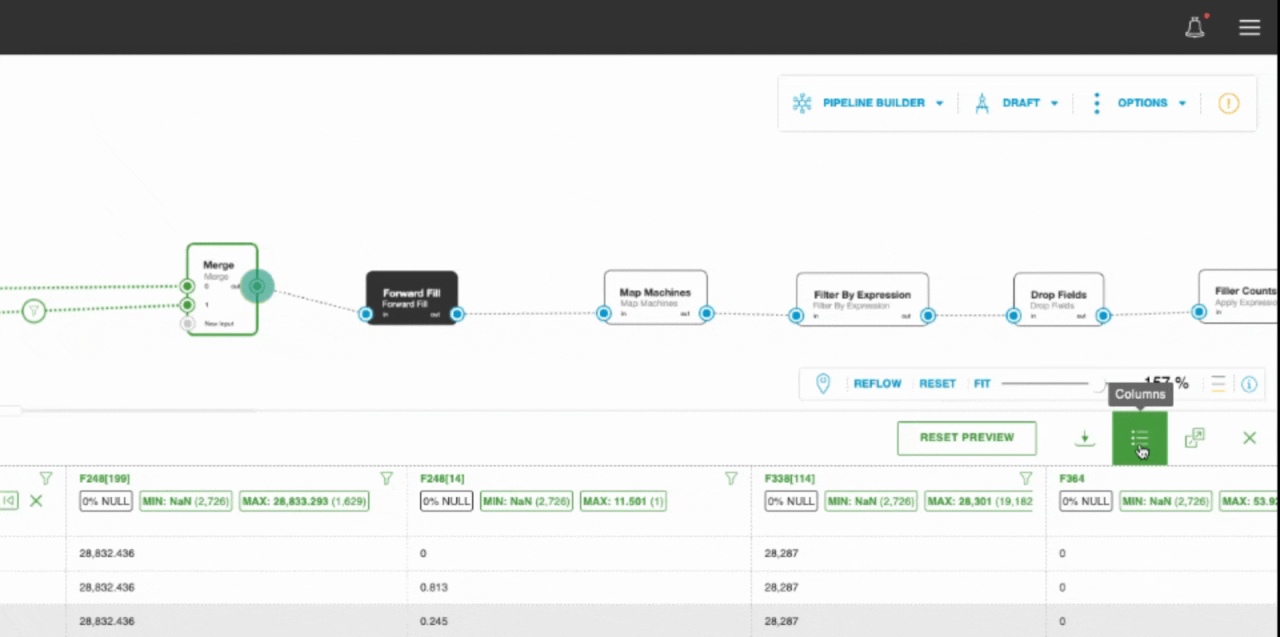
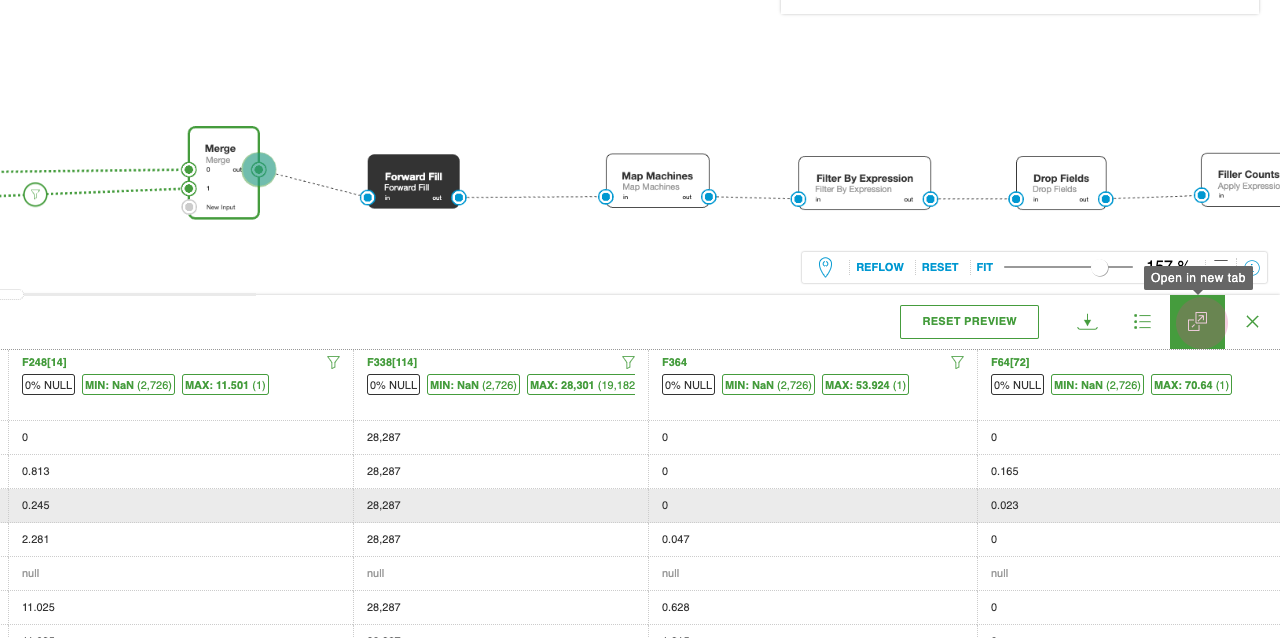
Full-Page Preview Results: You can open preview results in a new tab.
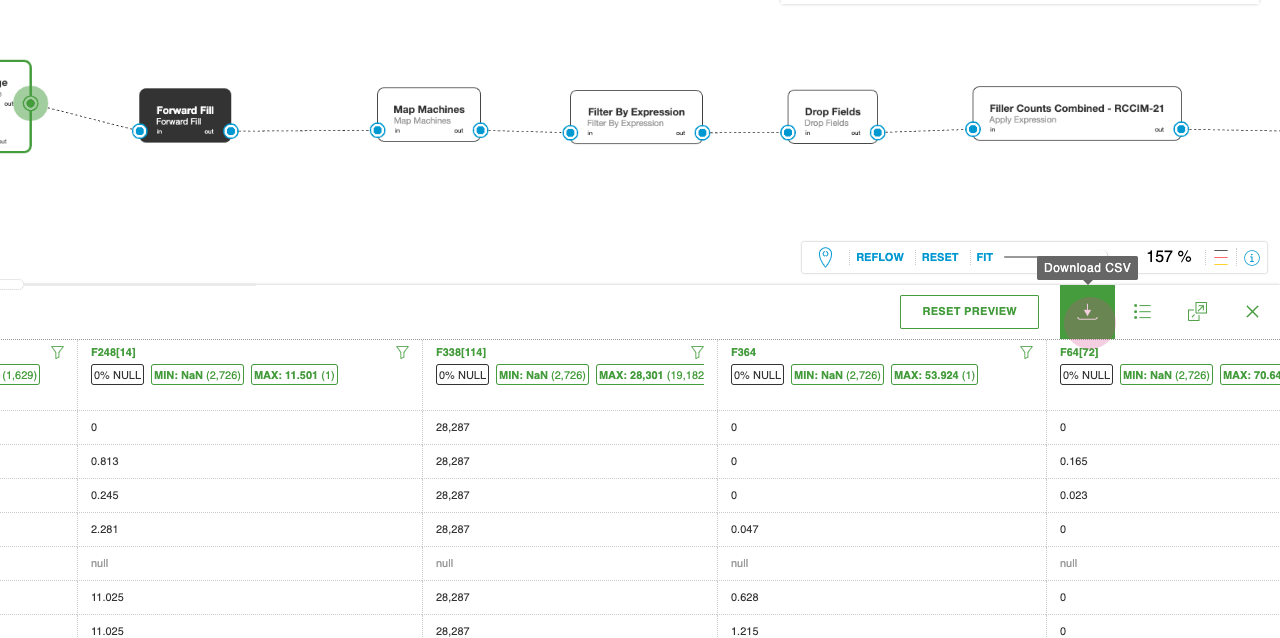
Download Results: Download the preview results to a CSV file.
Feature Benefits
Data Volume: Processed Significantly Reduced. Only records matching the filter are processed from the source/upstream. Full Volume processed all records are processed, but only a subset is displayed.
Preview Run: Time Faster. Reduced processing load leads to quicker completion and faster initial results. Slower time is dictated by the entire data volume being processed.
System Load: Lower less strain on the processing engine and data transfer. Higher the full dataset is processed in the background.
Use Case: Data validation on a specific subset of a huge dataset (e.g., only the last 5 minutes of data). Data inspection and visual sorting/filtering of already loaded results.
Persistence: The filter is part of the preview configuration. The filter is a transient view setting on the results table.
Summary
For optimal performance and efficiency when dealing with large datasets, always prioritize using Preview Filters. They act as a gatekeeper, reducing the overall data volume processed and resulting in significantly faster preview times. Column Filters should be used for final, visual refinement and inspection of the data already loaded into the results table. The streaming results workflow ensures you get a quick initial view while the full, filtered data set loads in the background.