Overview
Descriptive Statistics is a univariate exploratory tool designed to provide an in-depth look at the behavior of a single parameter, both in aggregate and over time. By utilizing the high-granularity Cycle model, the tool filters out non-production noise to focus exclusively on machine behavior during active cycles. It is most effective later in the exploratory process to validate trends, identify data drift, or spot anomalies in data capture frequency.
Specifications
Descriptive Statistics is a univariate analysis that you can perform on continuous and categorical fields on the Cycle model. You can select multiple machines of a given type. This analysis does not support the Part model because, when analyzing a single field, the extra context provided by the Part model is not required, and the Cycle model has higher granularity.
Analysis
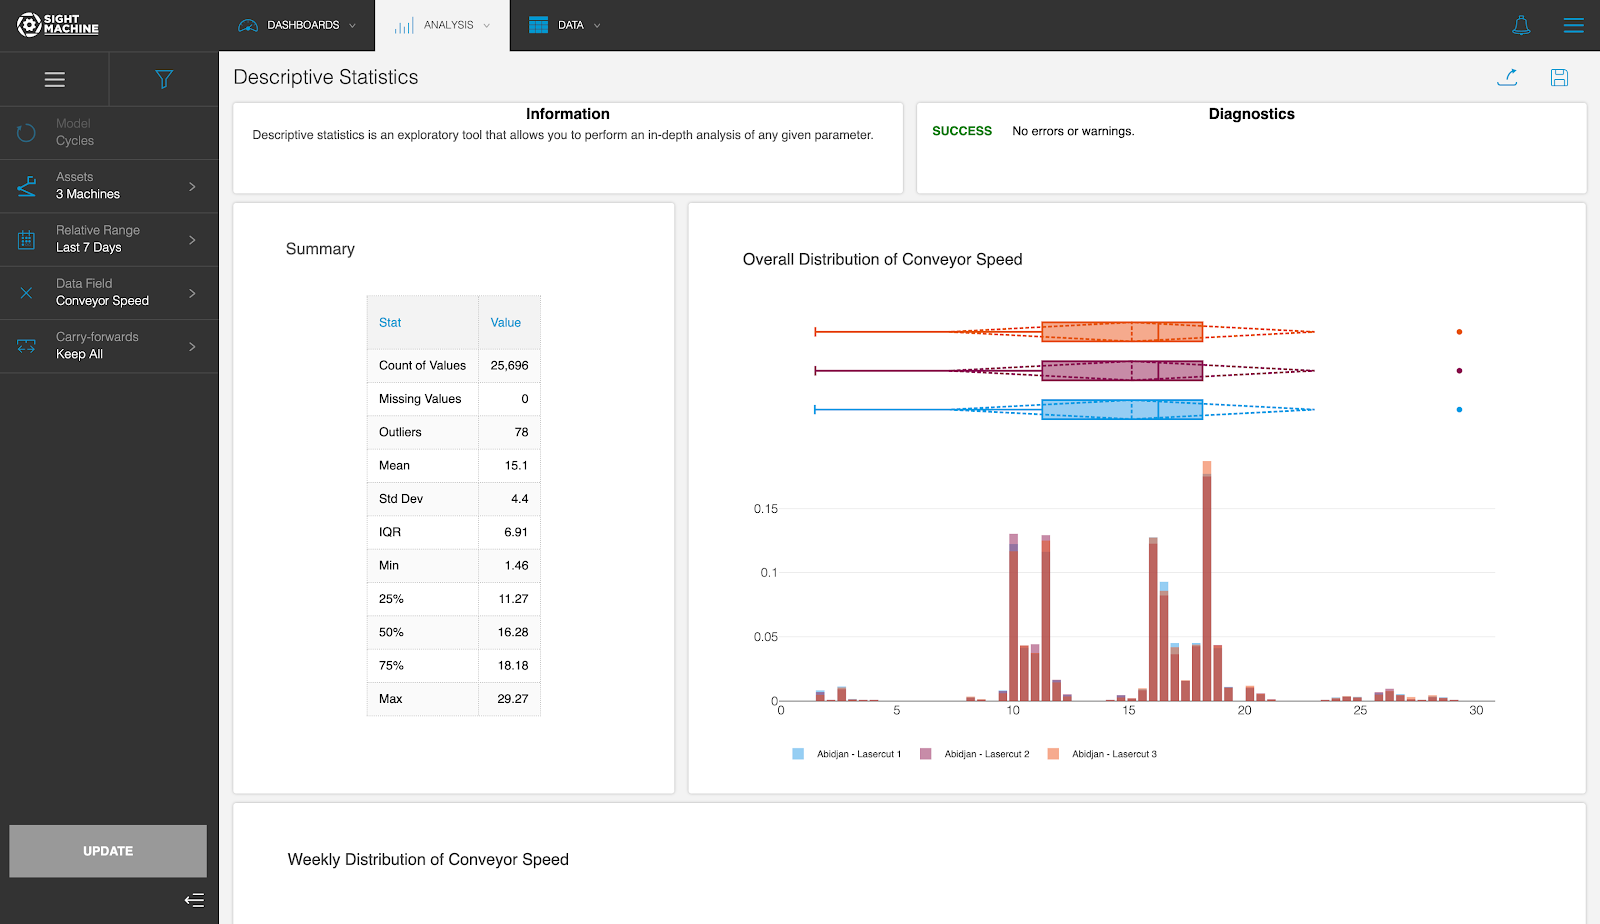
Descriptive Statistics is an exploratory tool that computes metrics about a particular parameter to analyze its behavior overall and over time. For continuous fields, the tool plots a histogram of the parameter and computes a table of summary statistics that includes Count, Standard Deviation, Minimum, and Maximum. For categorical fields, the tool computes the count and distribution of each category value. The tool also plots the parameter’s distribution by week, which can highlight drift over time, and the number of records from each day, which can highlight missing data.
How to Use Descriptive Statistics
The Descriptive Statistics tool allows you to perform an in-depth analysis of one single parameter.
NOTE: This tool works on both numeric and categorical fields.
This tool is built on a Cycles model so it ignores variability that happens outside the cycle (non-production data), which could interfere with the analysis vs. traditional variance analysis done via spreadsheets. The Cycles model summarizes parameter readings for each cycle, eliminating noise from higher granularity readings that may be too detailed for an exploratory analysis. Raw data can be analyzed if needed using the Raw Data Visualization tools.
To use Descriptive Statistics:
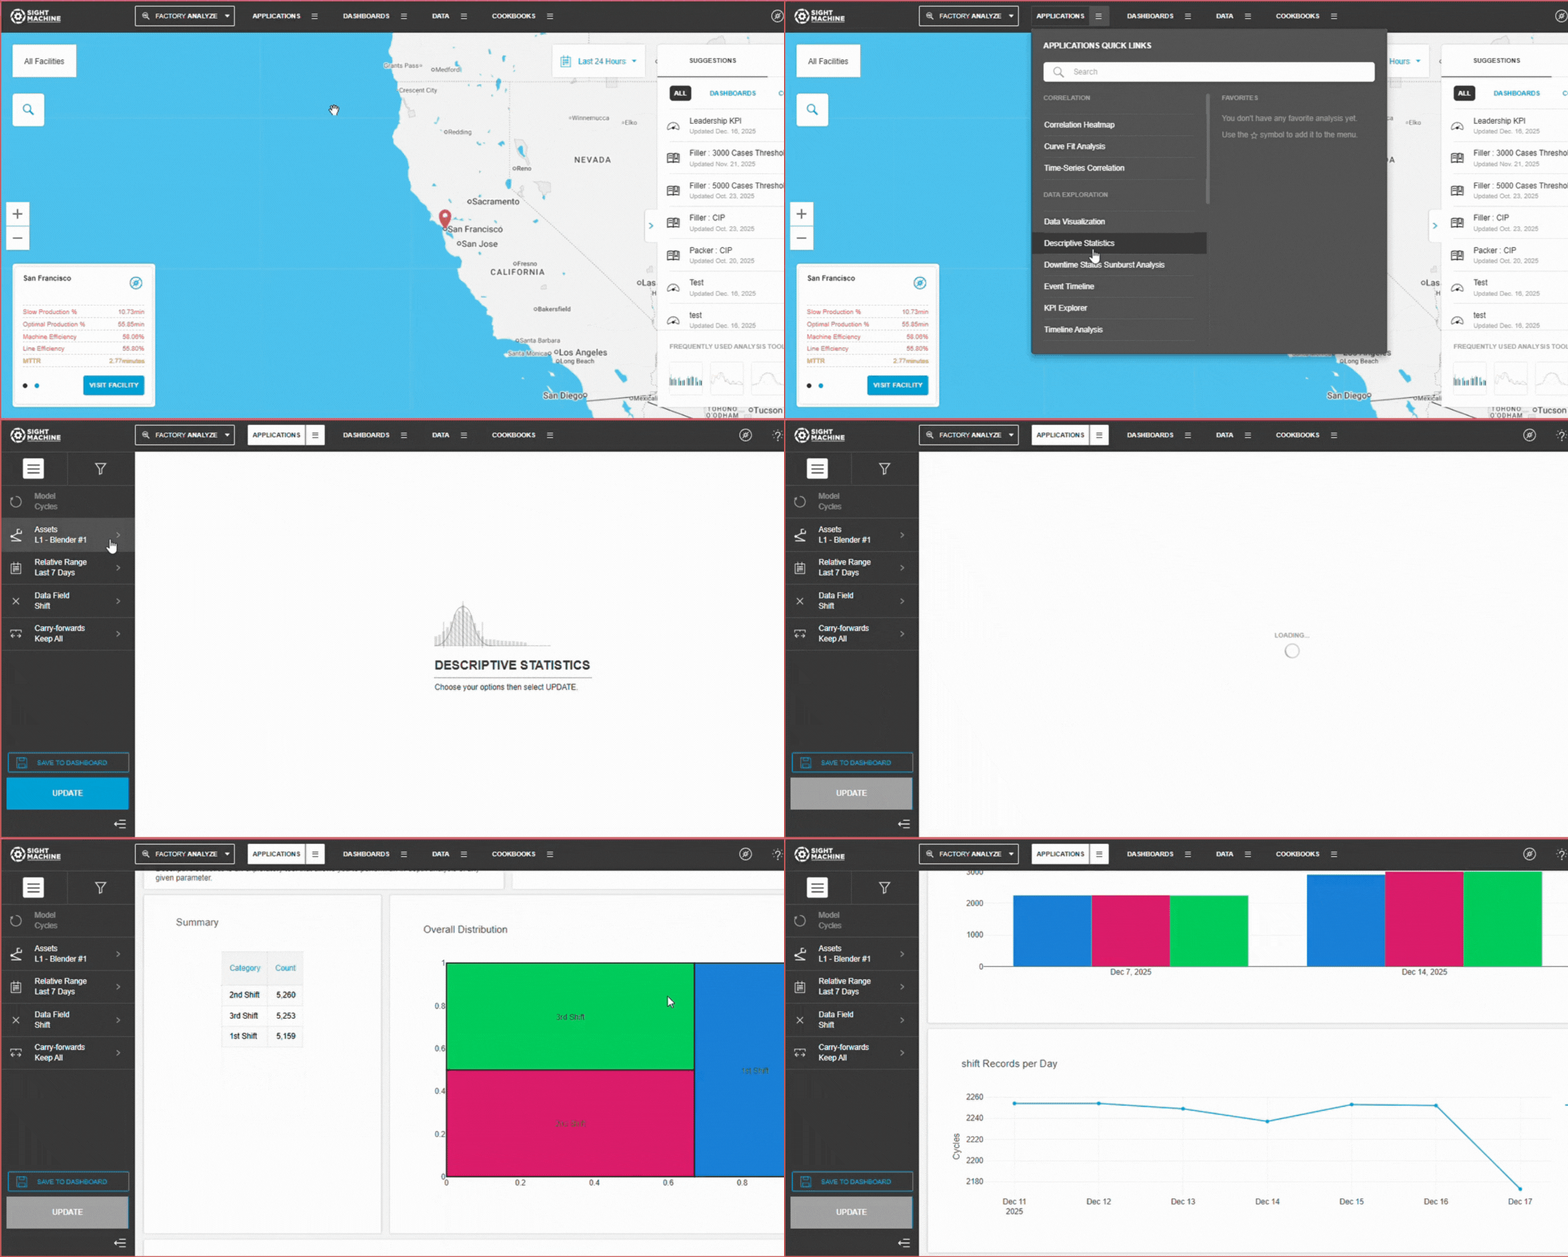
- On the Analysis tab, under Data Exploration, click Descriptive Statistics.
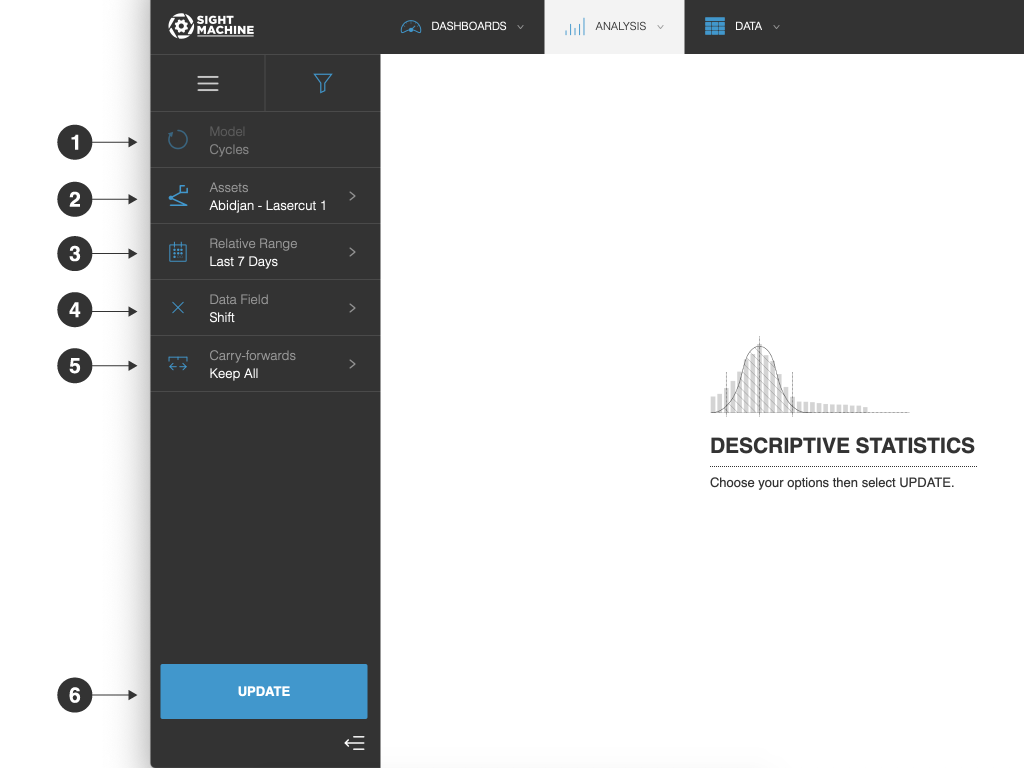
- On the main Descriptive Statistics screen, select your options on the left. For more details about each option, see Descriptive Statistics Options.
- Click Update.

Descriptive Statistics Options

The Descriptive Statistics options include:
- Model: You can analyze only cycles for a specific asset (AKA, machine). You cannot change this option.
- Assets: You can select one or more assets of the same type to analyze.
- Relative Range: You can define a date range of data points to analyze for the assets you have selected. For example, select the last 7 days. This option establishes the boundaries for the near real-time data that will be part of your analysis. Select from relative or absolute timeframes.
- Data Field: You can select the parameter that you want to investigate.
- Carry-forwards: You can undo the forward-fill effect on any fields. Select from Keep All, First, or Last. For more information, see the table in Options Common to All Analysis Tools.
- Update: Click this button to generate your chart.

Tool Output
The Descriptive Statistics tool displays a histogram for the selected parameter to visualize the overall distribution of its values, and a box plot to visualize the overall distribution, quartiles, and the standard deviation.
Underneath, there are box plots for the selected parameter broken down by week to illustrate potential drift over time, as well as a visualization of the records captured per day. This allows you to discover anomalies in the frequency of data capture.
Feature Benefits
Granular Behavior Analysis: Leverages the Cycle model to analyze parameters with high precision, ensuring that variability occurring outside of production cycles does not skew the statistical results.
Dual-Type Compatibility: Supports both continuous (numeric) and categorical data fields, providing relevant metrics like standard deviation and histograms for numbers, or distribution counts for categories.
Trend and Drift Detection: Visualizes parameter distribution by week using box plots, allowing users to identify "process drift" or gradual shifts in machine behavior over time.
Data Integrity Auditing: Includes a visualization of records captured per day, which serves as a diagnostic tool to highlight missing data or inconsistencies in the data ingestion pipeline.
Comprehensive Statistical Summary: Automatically computes essential metrics—including Count, Standard Deviation, Minimum, Maximum, and Quartiles—to provide a quantifiable baseline for any parameter.
Summary
The Descriptive Statistics tool provides a detailed statistical snapshot of a single parameter to help users understand its distribution and stability. By outputting a combination of histograms, box plots, and summary metric tables, it enables a clear visual and quantitative understanding of how a machine is performing.
Because it is built on the Cycle model, it is particularly effective at isolating production-only behavior, making it a superior choice to traditional spreadsheet analysis for identifying subtle process drift or anomalies in data capture. Whether you are validating a numeric sensor or a categorical state, this tool ensures your detailed exploration is based on clean, high-granularity data.