Downtime Model
- Print
- DarkLight
Downtime Model
- Print
- DarkLight
Article summary
Did you find this summary helpful?
Thank you for your feedback
Overview
The downtime model serves as a comprehensive representation of the duration during which a particular machine or equipment experiences an operational downtime event. This model is intricately linked to the cycle model through the associated machine, providing valuable insights into the temporal and causative aspects of downtime occurrences.
Downtime Tracking
The downtime model aggregates and manages information related to machine downtime, offering a detailed account of when and why a specific machine is non-operational over time. This tracking is especially useful in understanding and optimizing production efficiency.
Components of Downtime Records
Downtime records in Sight Machine are often sourced from multiple sources, combining data from various systems to provide a comprehensive overview of downtime events. The primary sources include:
Downtime System
Records downtime events, capturing essential details such as start time, stop time, and reason codes for the downtime.
Manufacturing Execution System (MES)
Associates downtime events with the specific product type that was in production during the occurrence of the downtime event. This linkage enhances the contextual understanding of downtime incidents.
Process Data
In certain scenarios, downtime start and stop times are determined based on process signals. This integration ensures that downtime events are accurately captured and aligned with relevant process data.
By combining information from these diverse sources, the downtime model provides a holistic view of operational interruptions, letting you analyze, mitigate, and optimize machine performance.
Analyzing Downtimes in Data Visualization
Although downtime events are stored as a single record, downtimes can be analyzed in a highly flexible manner.

Downtime Count
Gain valuable insights into downtime occurrences by visualizing them over time. With this flexible approach, you can analyze downtimes based on their start times or end times.
Start Time Analysis
On the X-axis, click Start Time to visualize the distribution of downtime events based on when they commenced.
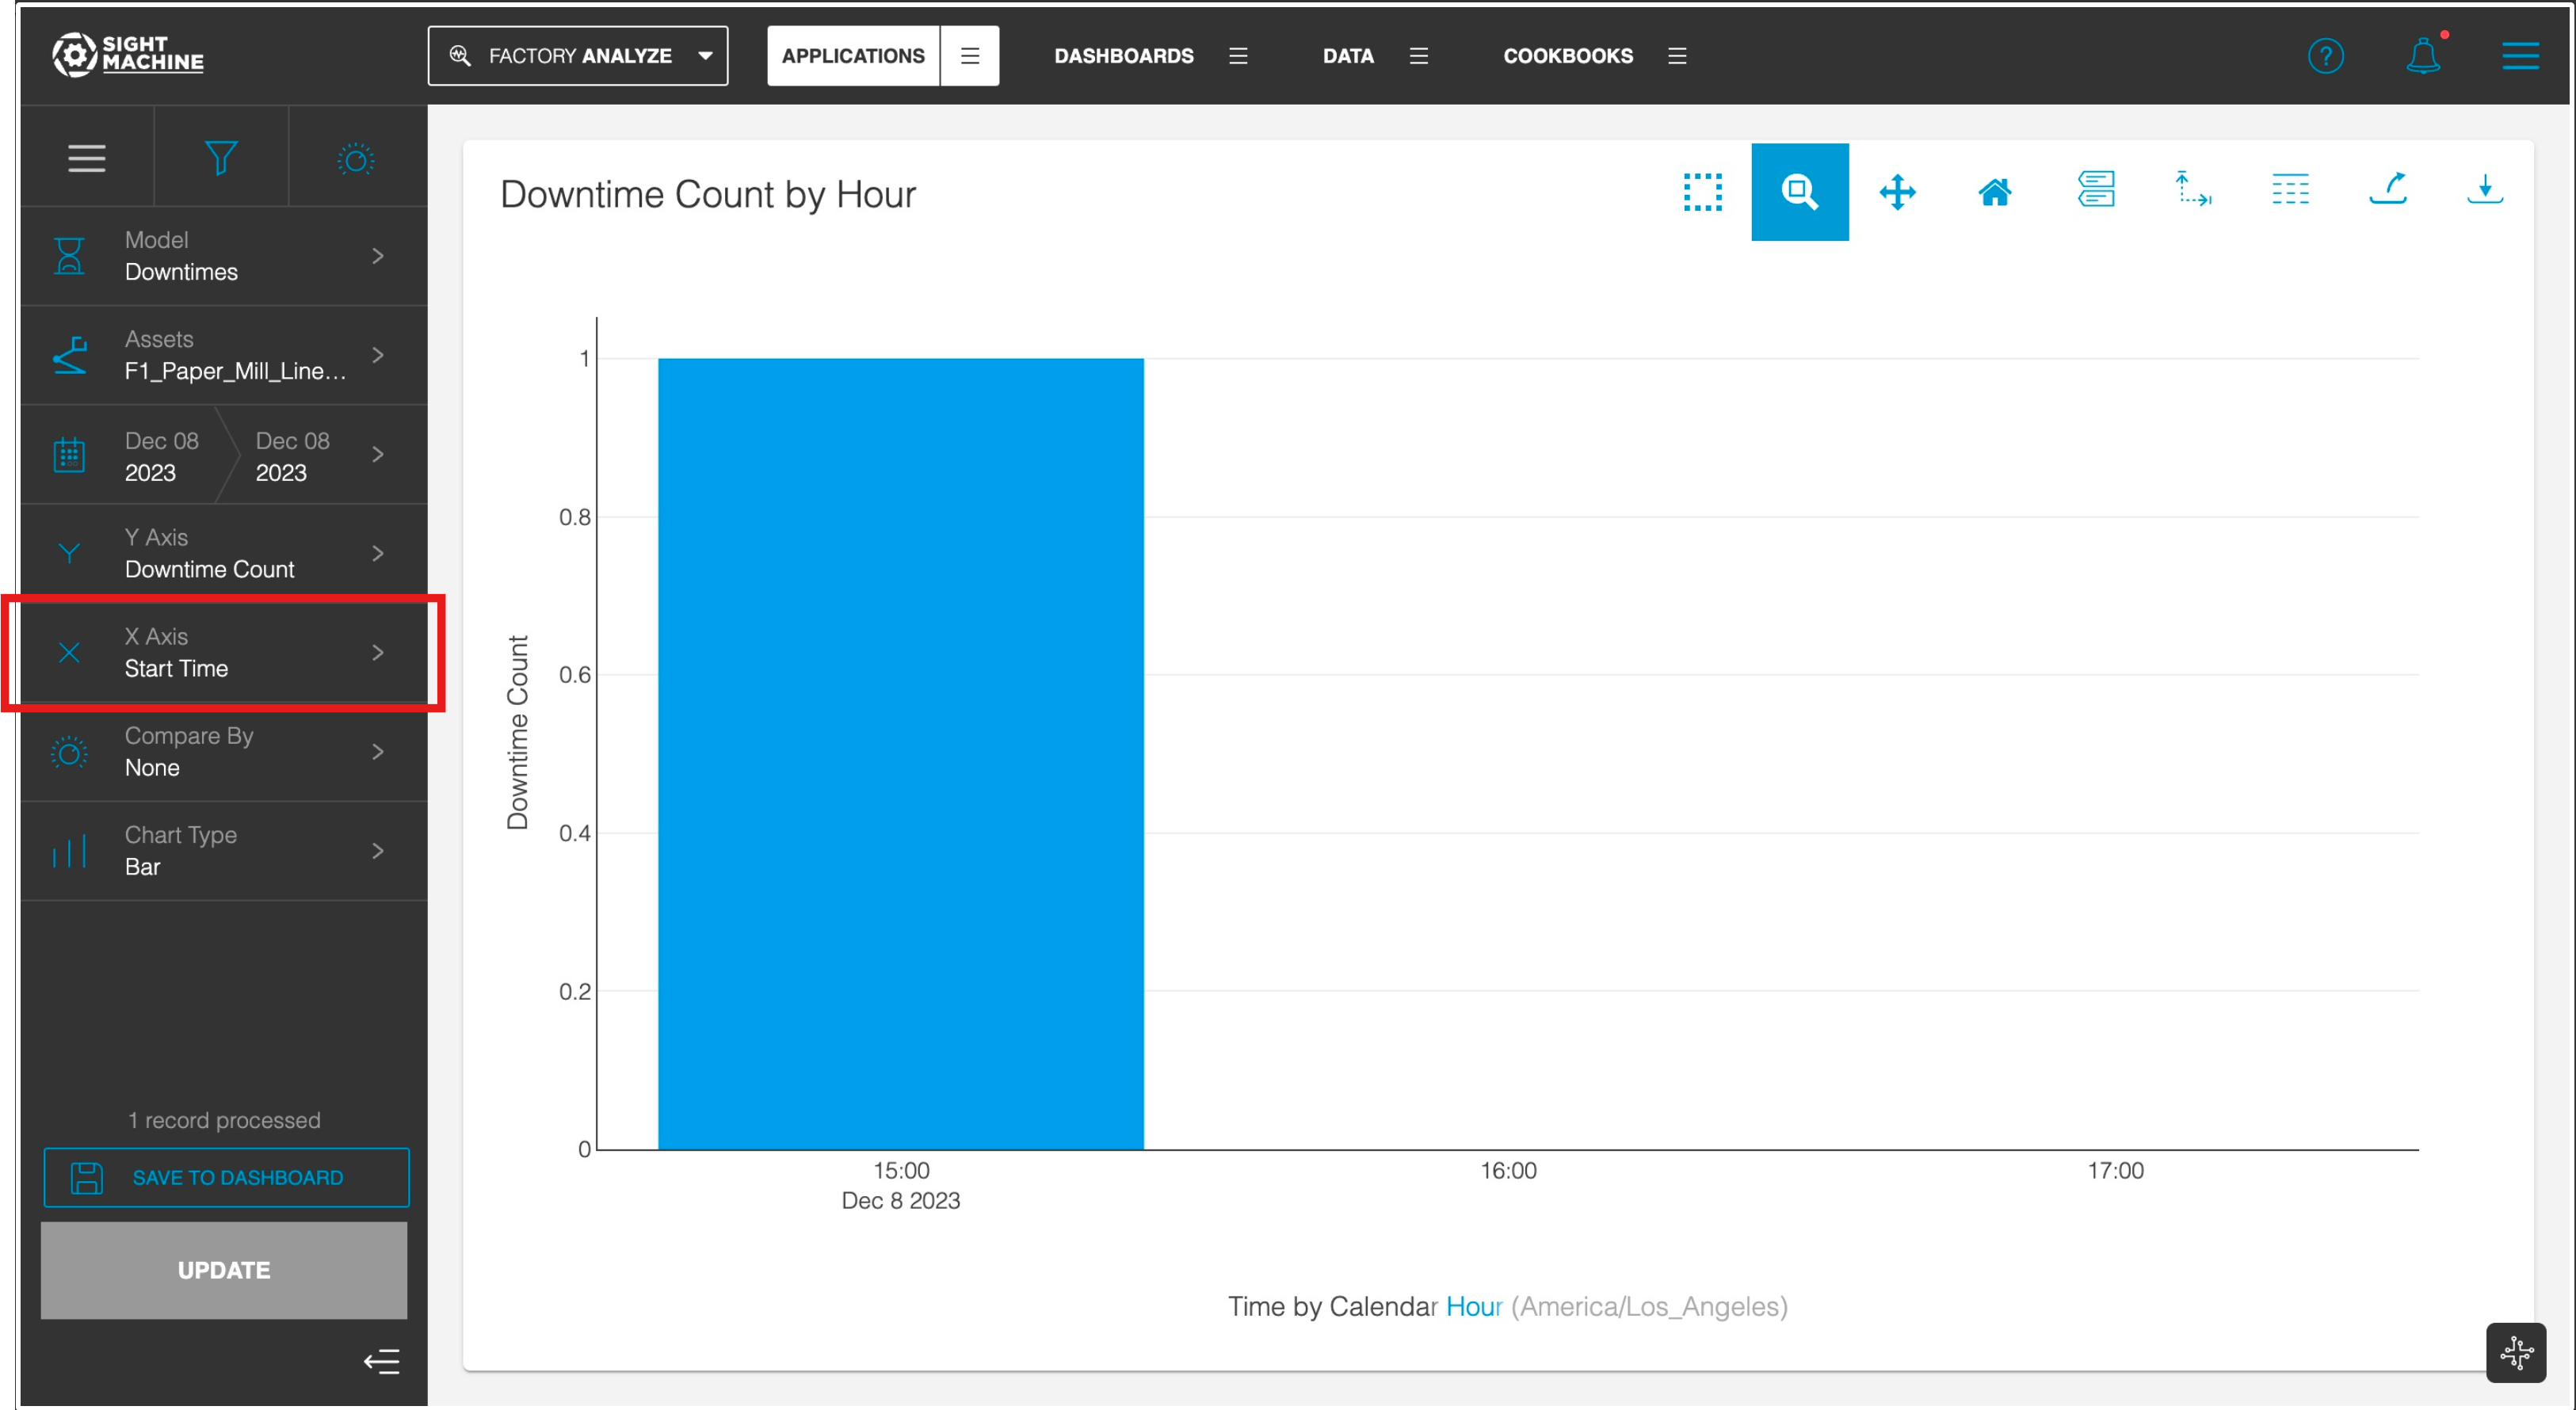
End Time Analysis
On the X-axis, click Time to observe the distribution of downtimes based on when they concluded.
.png "image(63).png")
This feature allows for a nuanced understanding of the timing patterns of downtime events, aiding in strategic decision making and operational improvements.
Downtime Duration
The Data Visualization tool intelligently allocates downtime event durations across relevant time bins when examining downtime duration.
Automatic Duration Allocation
For example, if a downtime event lasted 2 hours and you're analyzing downtime duration by the hour, the application distributes the total duration of 2 hours across the two 1-hour periods during which the downtime occurred.
.png "image(8).png")
This automated duration allocation provides a granular perspective on how downtime is distributed over time, facilitating in-depth analysis and actionable insights.