Event Timeline
The Event Timeline application shows the sequence and duration of events over time. This visualization is most helpful early in the exploration process to identify patterns that you want to investigate in more detail. This application can be followed on with other analysis applications such as Descriptive Statistics or Time-Series Correlation.
The Event Timeline is a univariate analysis that you can perform on the Downtime model, the Defect model, or a categorical field on the Cycle model. You can select multiple machines of a given type.
Analysis
The Event Timeline is an exploratory tool that shows events over time, split by a category. If you select the Downtime or Defect model, the events are automatically split by Downtime Reason or Defect Reason. If you select the Cycles model, the events are split by a categorical field that you would select. The analysis plots a trace from the beginning to the end of each individual event, with time on the X axis and category values on the Y axis. Note that the Sight Machine platform treats defects as instantaneous events; defects are marked with a single timestamp. In addition, consecutive cycles are collapsed into one event. For example, on a machine with 1-minute cycles, ten consecutive cycles with the same category are shown as one 10-minute block instead of ten 1-minute blocks.
How to Use Event Timeline
The Event Timeline application allows you to view events over time for a particular model.
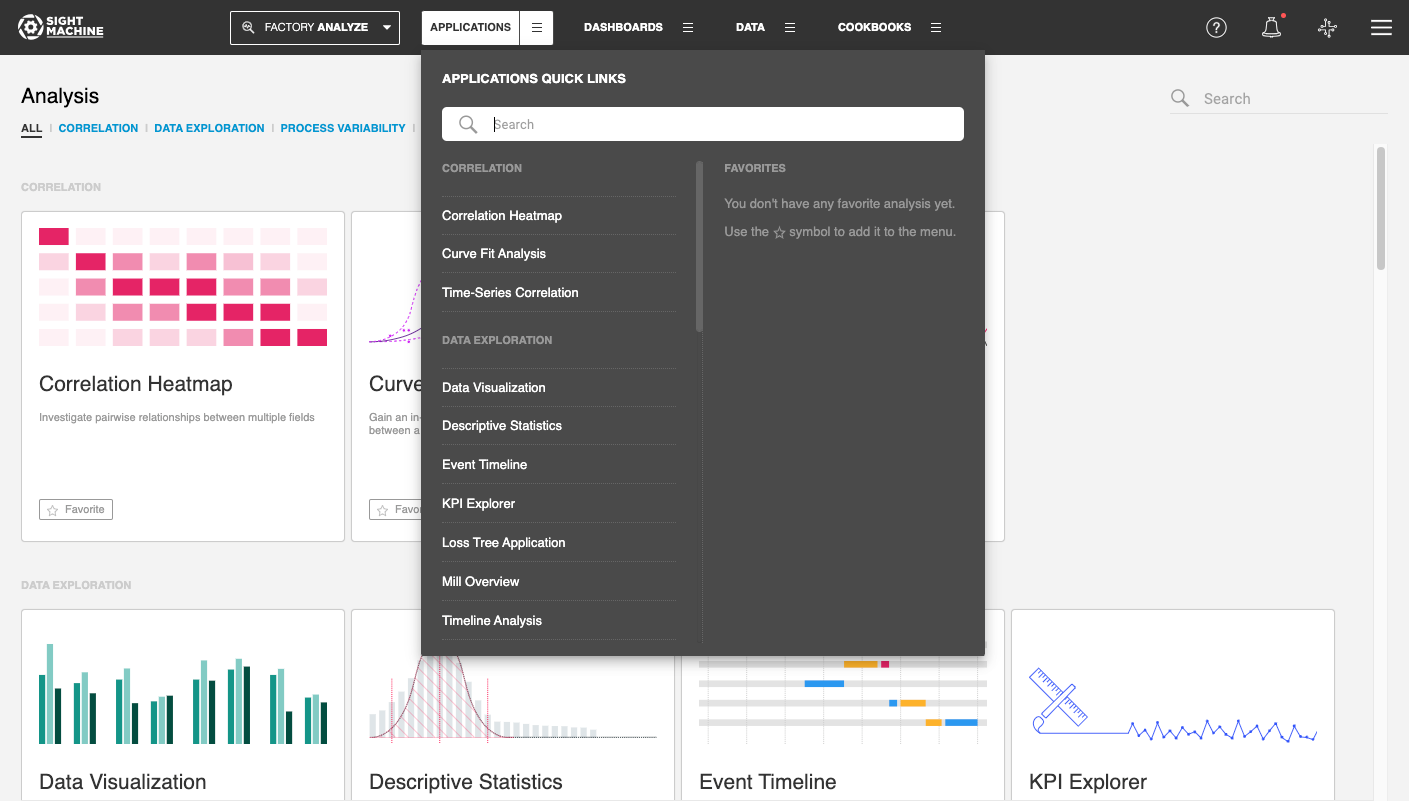
- On the Analysis tab, under Data Exploration, click Event Timeline.
- Once you are in the Event Timeline application, select your options using the sidebar on the left.
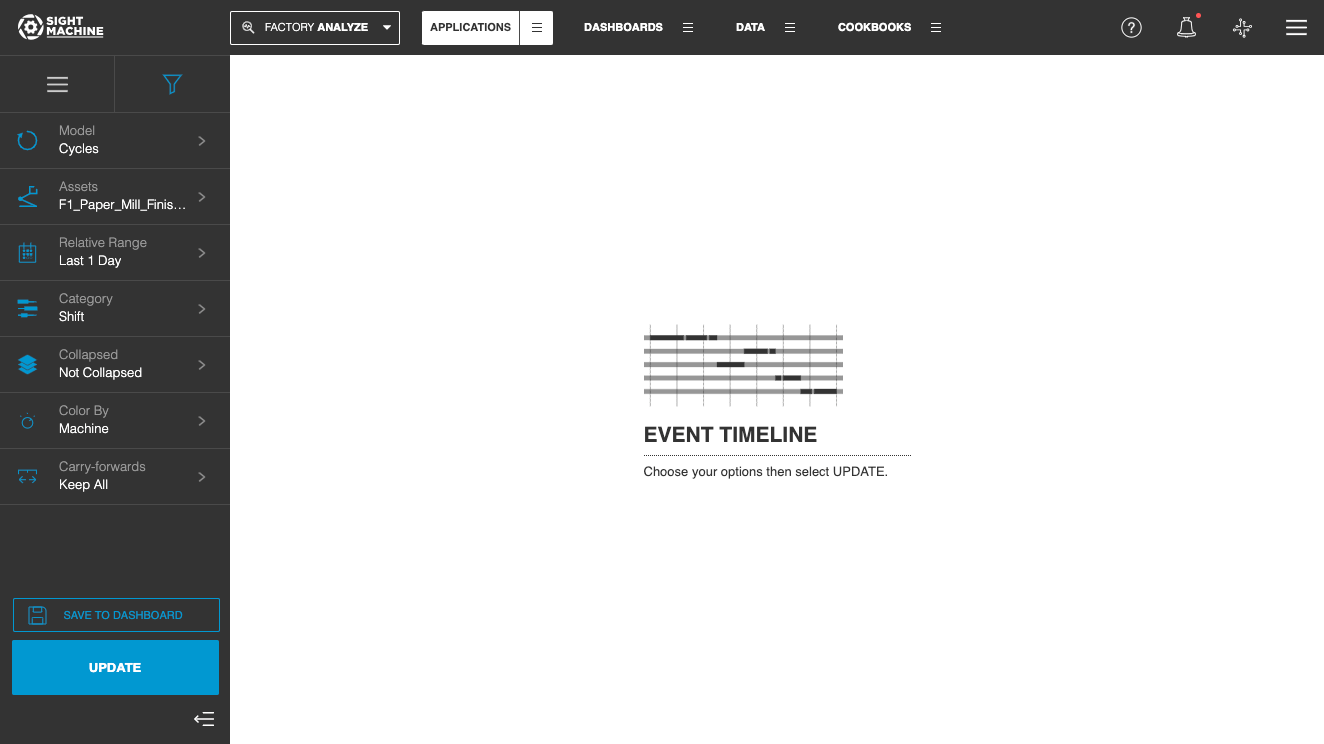
- The Event Timeline options include:
- Model:You can select:
- Cycles
- Defects
- Downtimes
For more information, see Models.
- Assets: You can select assets to monitor. For example, to perform a Cycles analysis, you need to select an asset to analyze. You can select 2 specific machines. If you are using the Parts model, you need to select a part type.
- Relative Range: You can define a date range of data points to analyze for the assets you have selected. For example, select the last 7 days. This option establishes the boundaries for the near real-time data that will be part of your analysis. Select from relative or absolute timeframes.
- Category: You can select a data field for comparison. Each unique value from this field is represented as a distinct timeline in the tool output.
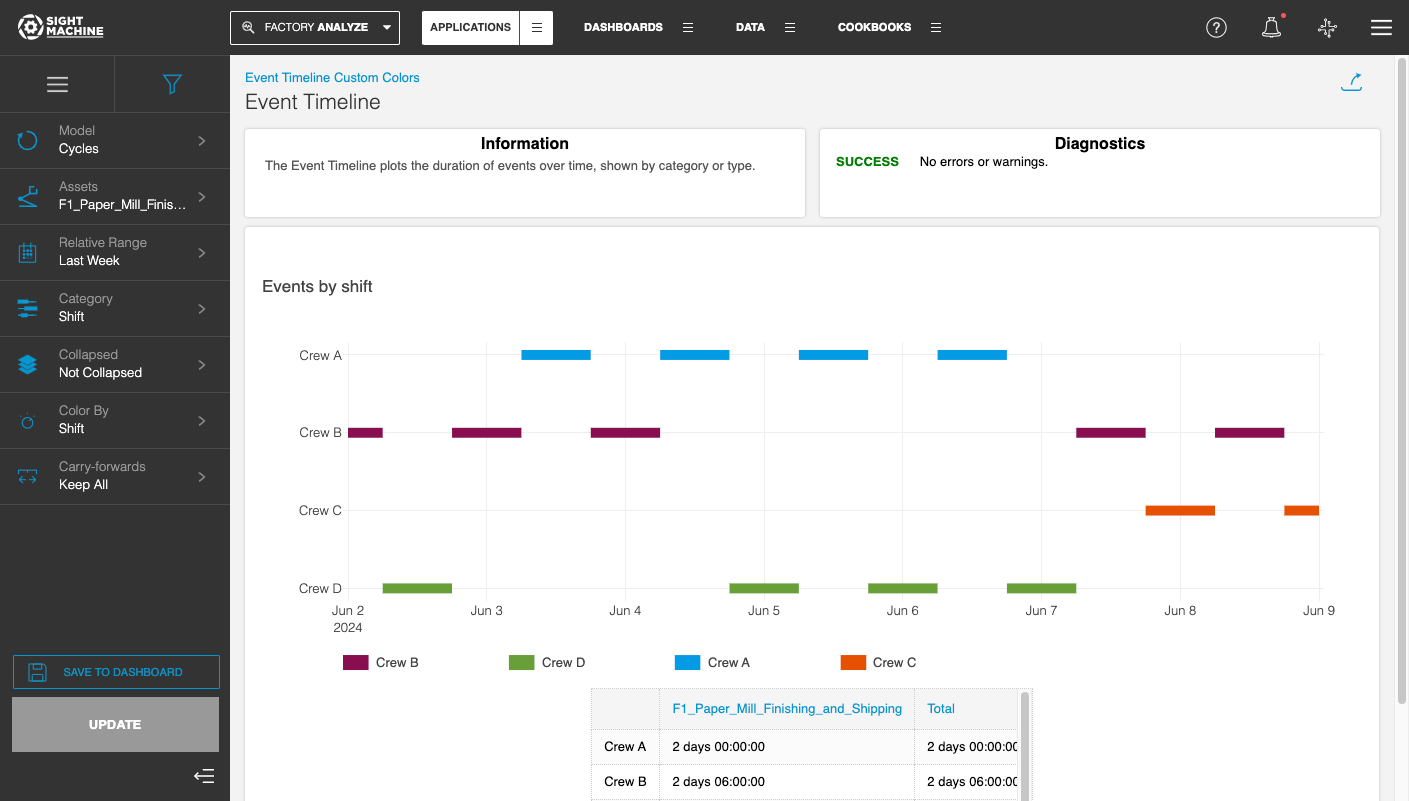
- Collapsed: You can specify if you want the data to be visualized in a single row (Collapsed) or in separate rows (Not Collapsed).
- Color By: You can specify a categorical data field that is used to split the data and display unique colors for each possible value of this data field. For example, you can display your data by Shift, by Downtime Reason, or Defect Reason.
- Carry-forwards: You can undo the forward-fill effect on any fields. Select from Keep All, First, or Last. For more information, see the table in Options Common to All Analysis Tools.
- Update: Click this button to generate your chart
- Model:You can select:
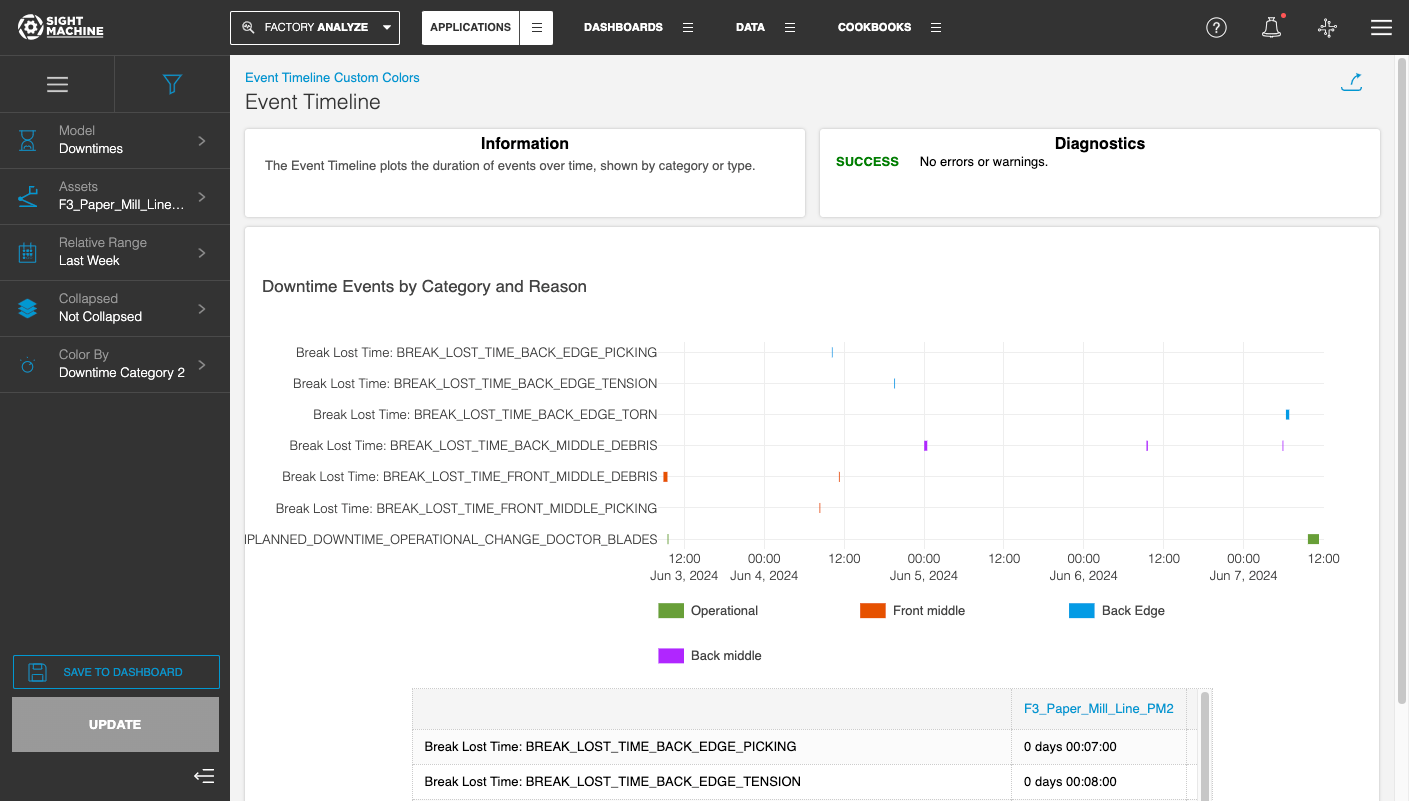
Customizing Colors for Event Timeline
The Event Timeline application now provides the ability to assign specific colors to each possible value of the "Color By" variable. This allows for a customized and visually distinct representation of data. If specific colors are not assigned, the application automatically assigns colors.
To customize the colors displayed in the Event Timeline, please contact your Customer Success representative and provide the specific data field values and color codes for each possible value. Color codes must be specified in 6-digit Hexadecimal format, for example, #1B03A3.
For example - in the visualization below, the "Back Middle" Downtime Category 2 has been specified to be displayed in purple using the color code #B026FF.