Contents x
- Overview
- Factory CONNECT
- Device Configuration
- FactoryTX
- Introduction
- API Keys
- Environment Variables
- Receivers
- General Receivers
- Amazon S3 Data Receiver
- Azure Data Lake Data Receiver
- Azure Data Lake Storage Gen2
- Azure Iot Hub Receiver
- Enact Data Receiver
- File Receivers
- GE Proficy Historian Receiver
- MQTT Data Receiver
- Local File Data Receiver
- OPC UA Data Receiver
- PI Web Data Receiver
- SMB Data Receiver
- Snowflake
- SQL Data Receiver
- Weather Data Receiver
- Custom Receivers
- General Receivers
- Parsers
- Transforms
- Transmits
- Virtual Machine
- API Reference
- RawQ Topics
- Blueprint
- Factory BUILD
- Factory ANALYZE
- Analysis Tools
- Introduction
- Options Common to All Analysis Tools
- Date Picker
- Data Field Picker
- Correlation Tools
- Time-Series Correlation
- Correlation Heatmap
- Curve Fit Analysis
- Data Exploration Tools
- Data Visualization
- Data Visualization: Aggregate Function
- Data Visualization: Chart Type Options
- Visualizing KPI and Non-KPI Data on the Same Chart
- Descriptive Statistics
- Event Timeline
- Feature Importance Analysis
- Timeline Analysis
- Process Variability Tools
- Statistical Process Control
- Variance Analysis
- Raw Data Monitoring
- Raw Data Visualization
- OEE Visibility
- Custom Analysis Tools
- Cookbooks
- Dashboards
- Data Tables
- Intelligent Alerting
- KPI Explorer for Loss Analysis
- Platform Configuration
- Analysis Tools
- Factory OPERATE
- Factory COPILOT
- Factory Namespace Manager
- Integrations
- Technical Support
- User Administration
- Release Notes
- Product Updates - February 27, 2025
- Product Updates - January 30, 2025
- Product Updates - October 3, 2024
- Product Updates - September 19, 2024
- Product Updates - September 5, 2024
- Product Updates - August 22, 2024
- Product Updates - August 8, 2024
- Product Updates - July 25, 2024
- Product Updates - July 11, 2024
- Product Updates - June 27, 2024
- Product Updates - June 13, 2024
- Product Updates - May 30, 2024
- Product Updates - May 16, 2024
- Product Updates - May 2, 2024
- Product Updates - April 18, 2024
- Product Updates - April 4, 2024
- Product Updates - March 21, 2024
- Product Updates - March 7, 2024
- Product Updates - February 26, 2024
- Product Updates - February 8, 2024
- Product Updates - January 25, 2024
- Product Updates - January 11, 2024
- 2023
- Product Updates - December 18, 2023
- Product Updates - November 30, 2023
- Product Updates - November 16, 2023
- Product Updates - November 2, 2023
- Product Updates - October 19, 2023
- Product Updates - October 5, 2023
- Product Updates - September 21, 2023
- Product Updates - September 7, 2023
- Product Updates - August 24, 2023
- Product Updates - August 10, 2023
- Product Updates - July 27, 2023
- Product Updates - July 13, 2023
- Product Updates - June 29, 2023
- Product Updates - June 15, 2023
- Product Updates - June 1, 2023
- Product Updates - May 18, 2023
- Product Updates - May 4, 2023
- Product Updates - April 20, 2023
- Product Updates - April 6, 2023
- Product Updates - March 9, 2023
- Product Updates - February 9, 2023
- Product Updates - January 12, 2023
- 2022
- Product Updates - December 15, 2022
- Product Updates - December 1, 2022
- Product Updates - November 10, 2022
- Product Updates - October 27, 2022
- Product Updates - October 14, 2022
- Product Updates - October 13, 2022
- Product Updates - September 15, 2022
- Product Updates - September 1, 2022
- Product Updates - August 18, 2022
- Product Updates - August 4, 2022
- Product Updates - July 21, 2022
- Product Updates - July 7, 2022
- Product Updates - June 9, 2022
- Product Updates - May 26, 2022
- Product Updates - May 12, 2022
- Product Updates - April 28, 2022
- Product Updates - April 14, 2022
- Product Updates - March 31, 2022
- Product Updates - March 2, 2022
- Product Updates - February 2022
- Additional Resources
Article summary
Did you find this summary helpful?
Thank you for your feedback
You can generate time series and distribution charts of your raw data.
To generate a Raw Data Visualization:
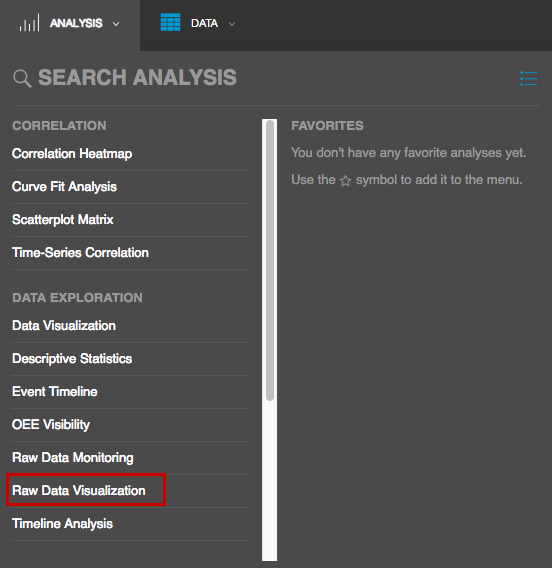
- On the Raw Data tab, click Raw Data Visualization.
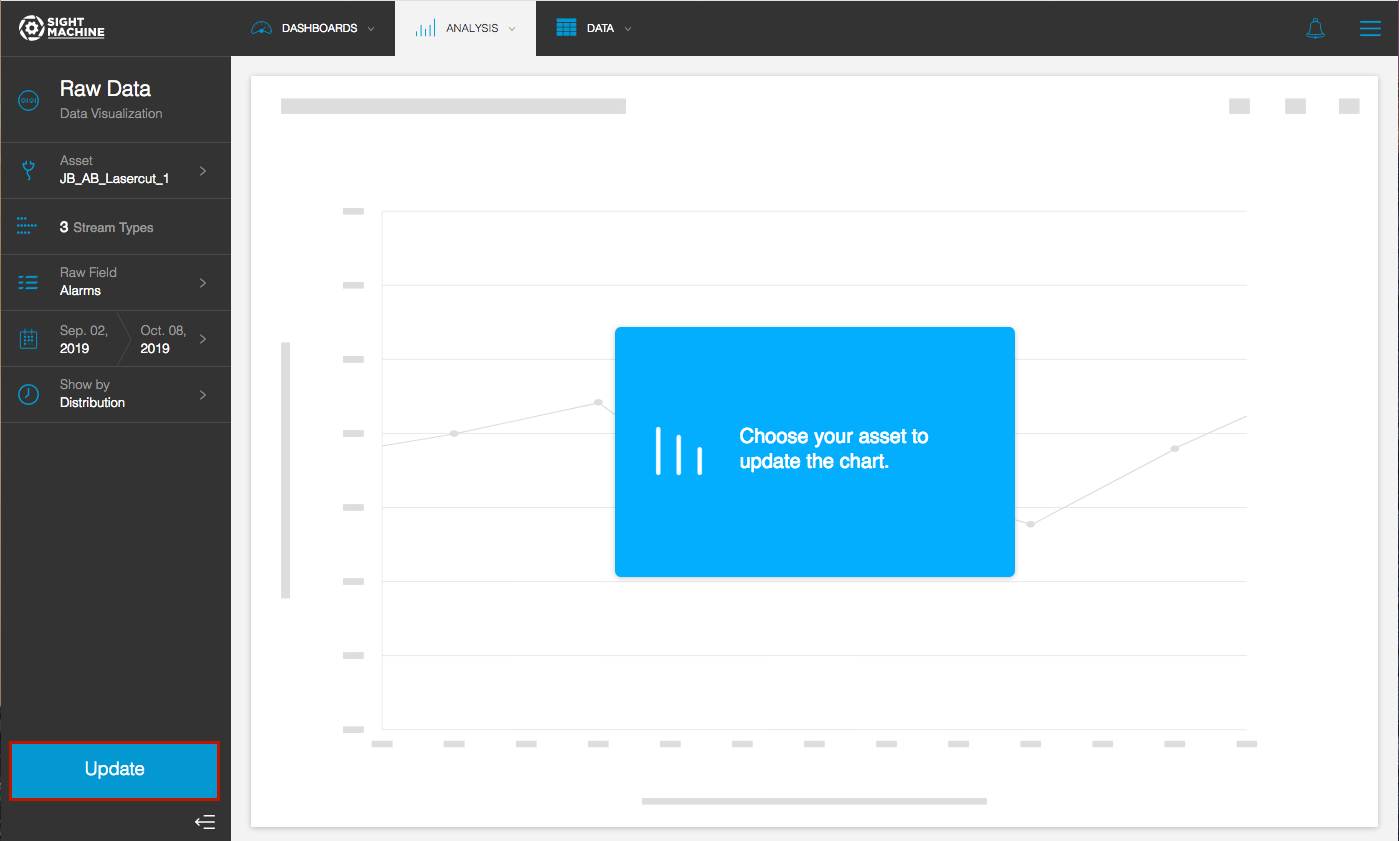
- On the main Raw Data Visualization screen, you can choose your options on the left.
For more information, see Selecting How to Visualize the Raw Data. - Click Update.
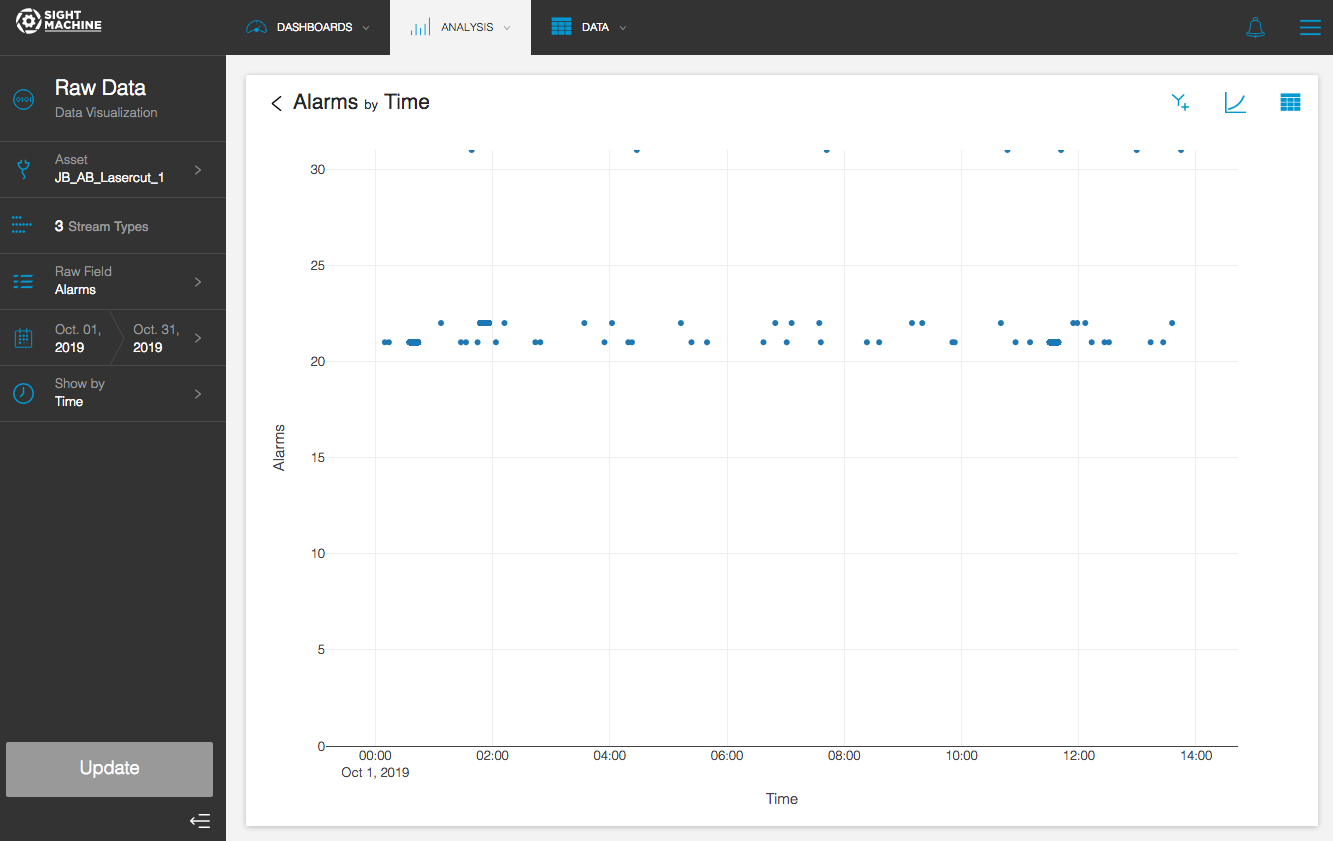
- View the results. This example shows a scatterplot of alarms by time.