Overview
Intelligent Alerting is a proactive monitoring system designed to provide real-time visibility into manufacturing operations. By continuously analyzing incoming data against user-defined criteria, the tool automatically identifies anomalies and performance shifts, notifying stakeholders immediately when issues arise. This eliminates the need for manual data monitoring and allows teams to transition from reactive troubleshooting to proactive intervention.
Configuring Alerts in the User Interface
The Sight Machine platform currently allows you to create the following types of alerts:
- SPC: Use to monitor for breaches in specification limits, both upper and lower.
- KPI: Use to monitor KPIs at the machines, line, process area, and plant level
- Data Latency Monitoring: Use to monitor outages in source data connectivity.
In addition to user-configured alerts, Sight Machine offers Automated Production Latency alerts to enable you to automatically detect issues related to data latency.
Creating Alerts
To create alerts, you can use the Manage Alerts page, or use an in-Application link, which is available for SPC Alerts.
Create an alert on the Manage Alerts page
- To navigate to the Alerts landing page, in the upper-right corner of the page, click the bell icon, and then click Manage Alerts.
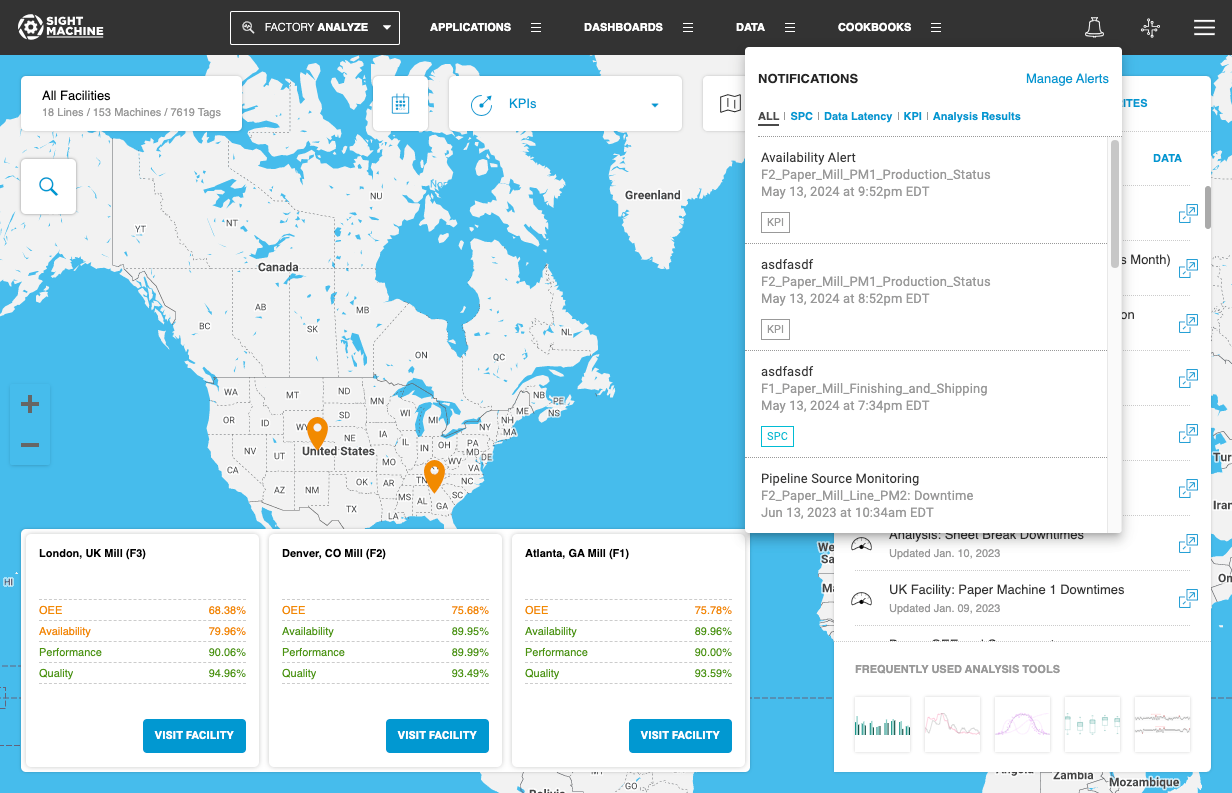
- In the upper-right corner, click the plus (+) icon, and then select the application that you want to use.
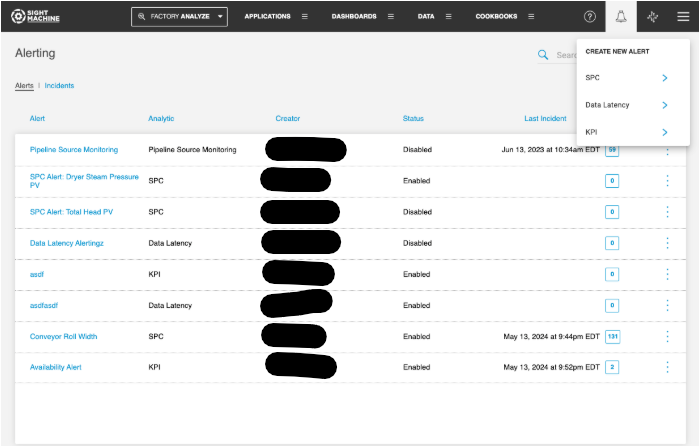
NOTE: Basic users only have access to create SPC and KPI alerts. Users with Developer or Administrator roles can also create Data Latency alerts.
Create an SPC alert from the SPC application
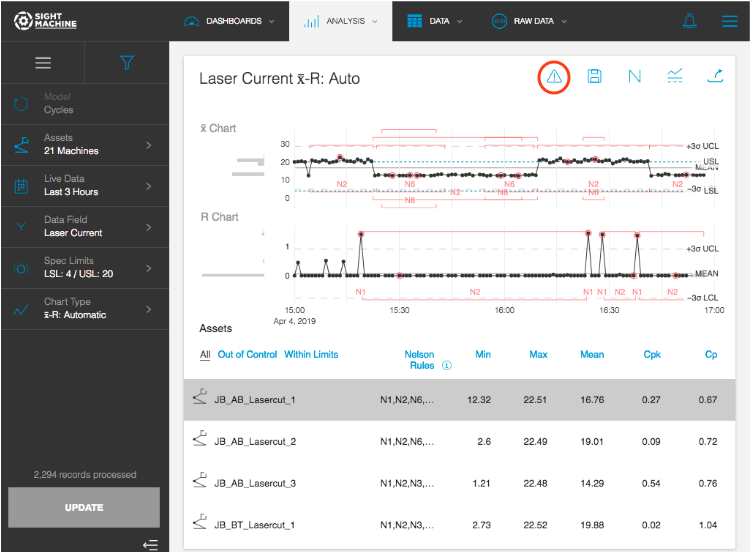
- Navigate to the Statistical Process Control (SPC) application, enter your parameters, and then click Update.
- After your results return and you want to use those parameters within an alert, click the Create Alert icon in the upper-right corner. Generating an alert from within the application will pre-load alert parameters such as Machines, Data Field, Chart Type, and Spec Limits into the alert configuration.
All Alert Types - SPC, KPI, and Data Latency Alerts - have the following configuration sections in common:
- Parameters: The application-specific input parameters
- Alert Criteria: The application-specific alert criteria
- Monitor Frequency: The frequency with which the application is run and how often you are notified
- Notification: The configuration of the notification subject and recipients
Configuring SPC Alerts
SPC Alerts are typically used to monitor process performance, and a variety of control chart types are supported.
- From the Alerts page, click on Create new Alert -> SPC
- Select the Machines and Data field that you want to monitor
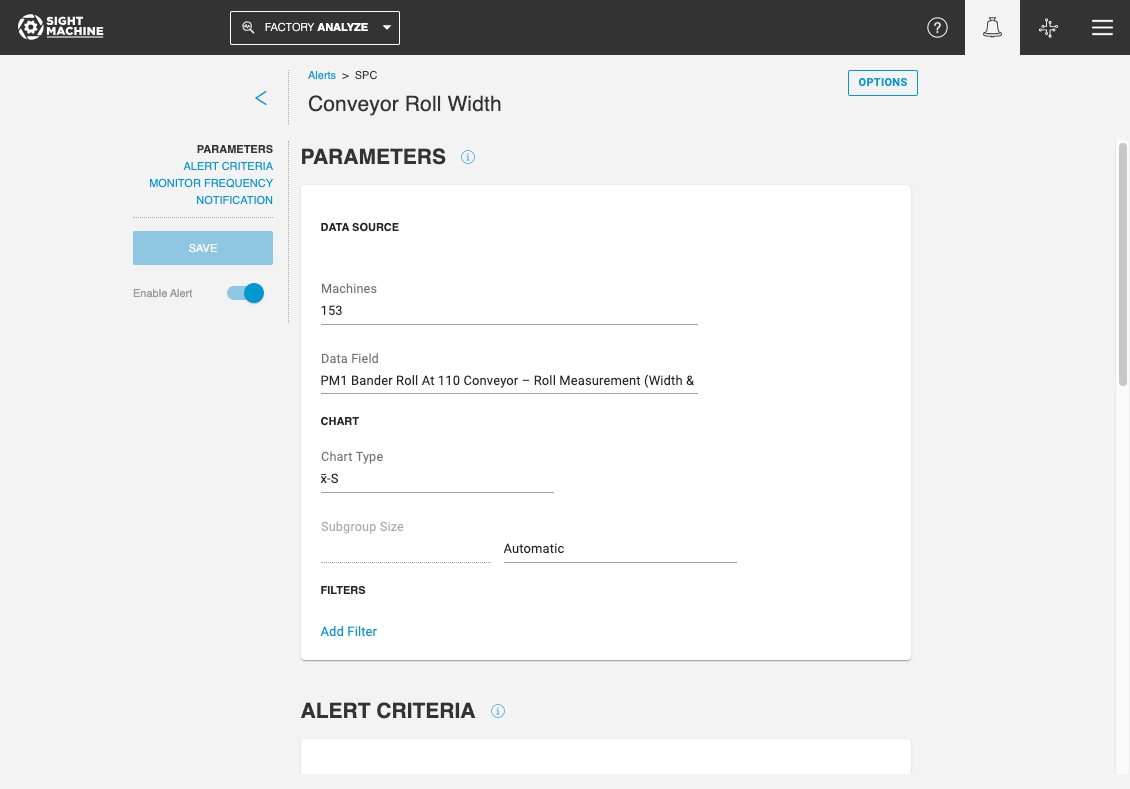
- Select a Chart Type to specify which chart values are used to trigger the alert.
- X-bar R, X-bar S, and I-MR
- Select a Subgroup size
- Automatic subgroup size is determined based on how frequently the alert is monitored. For example, if the Alert is checked every 24 hours, the Subgroup size is automatically set to 1 hour.
- You can manually specify a subgroup size, in units of Seconds, Minutes, or Hours.
- To monitor individual data points of the selected Data Field, you can set your subgroup to a very small size such as 1 Minute, or select Chart Type of I-MR, as this chart type does not use subgroups.
- Add Filters to further define the parameters for the SPC Chart. Filters support both Continuous and Categorical variables.
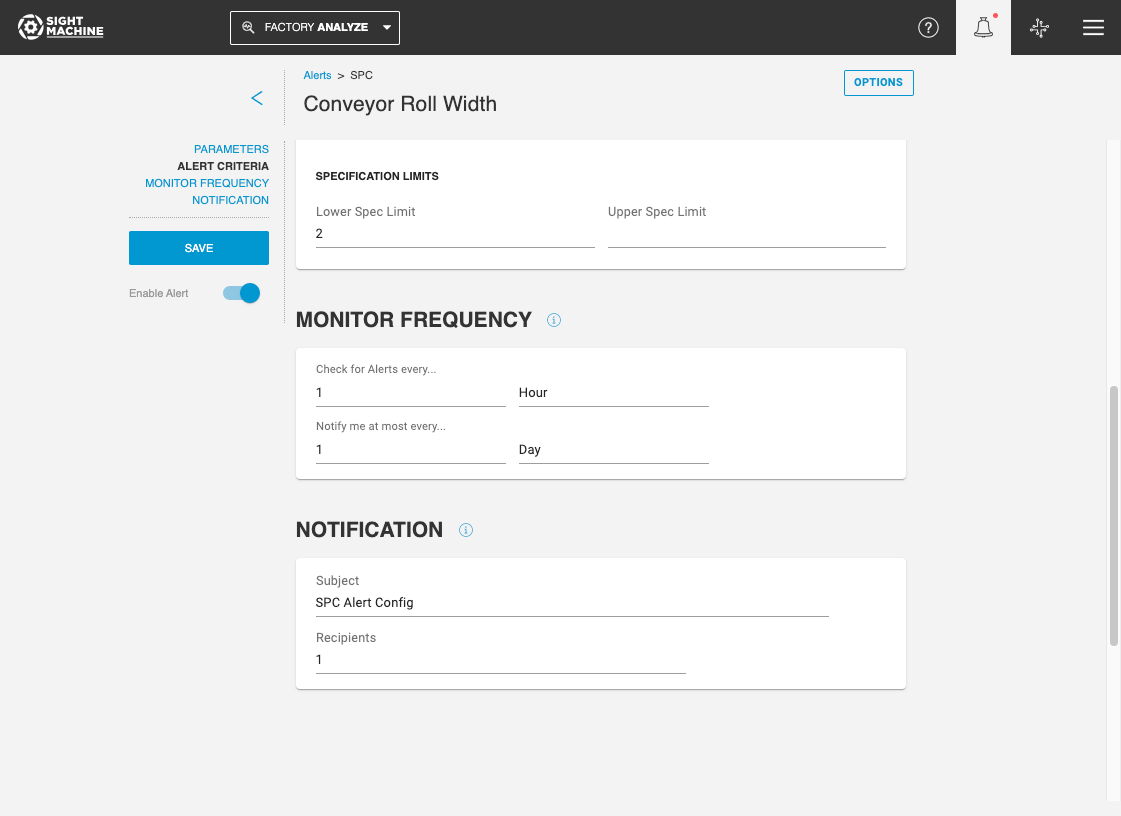
- Set your specification limit alert criteria in the Alert Criteria section. An incident is triggered if a value falls outside of the specification limits. You only need to enter a value for either Lower Spec Limit or Upper Spec Limit, but can enter both if needed.
- Specify the frequency at which the alert is checked, as well as the notification frequency, in the Monitor Frequency section.
- Check for alerts every... is the frequency at which the alert condition is checked. This can be in Minutes, Hours, or Days. For example, if this is set to 1 Day, the alert condition is checked once every day, in the 24-hour period starting from the time at which the alert was created.
- Notify me at most every...is the frequency of how often a notification is sent when the alert condition is met. This can be in Minutes, Hours, or Days. You may want to check the alert every Hour, but only be notified once a day.
- Specify alert notification details such as Email Subject and email recipients in the The Notification section. Notifications are sent both via e-mail and in-platform. Alert recipients must be users in Sight Machine; external email IDs are not supported.
Configuring KPI Alerts
KPI Alerts enable you to monitor KPIs at the machine, shift, line, process area, or plant level.
- From the Alerts page, click on Create new Alert -> KPI
- Select the KPI you want to monitor, and the Machine(s) it is defined on.
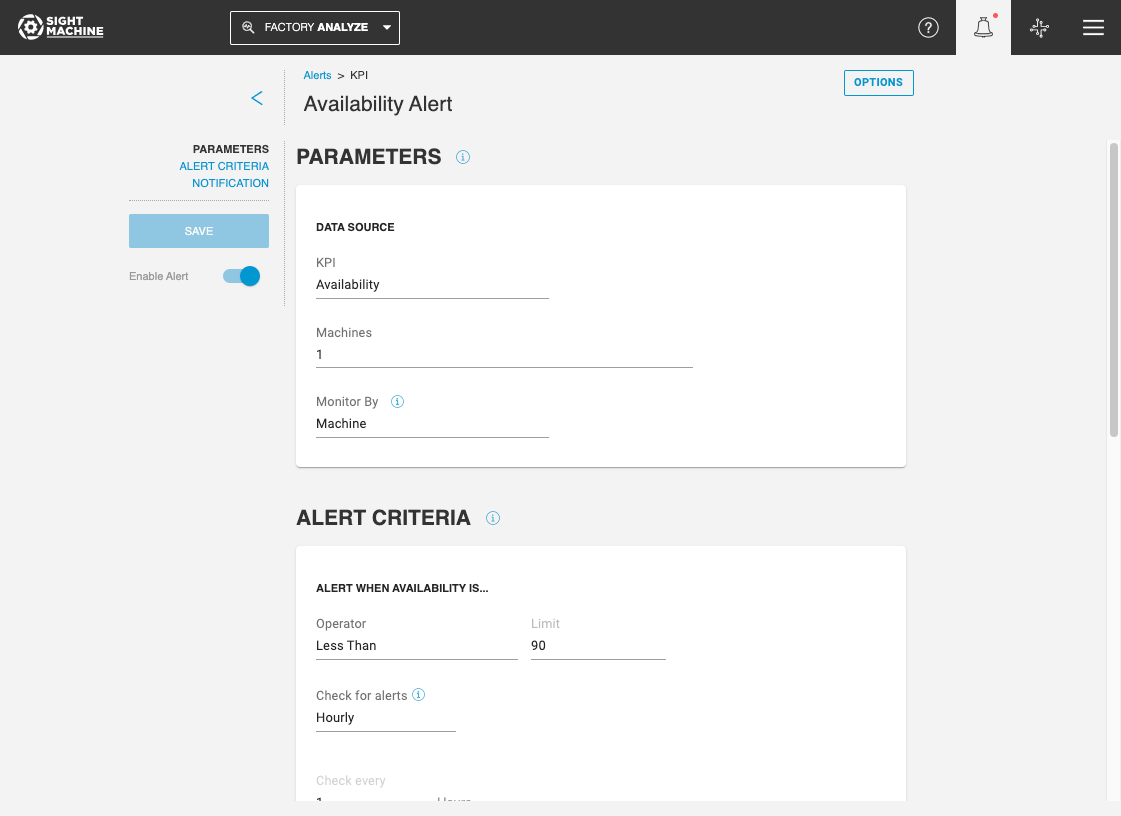
- Specify the Monitor By field to monitor KPIs by Machine, Shift, Product, and other fields. The criteria specified in "Monitor by" will calculate KPIs as the desired level. For example, if you choose to "Monitor by: Machine", the KPI will be calculated individually for each machine. If you choose to "Monitor by" Factory Location, the KPI will be calculated for each plant.
- In the Alert Criteria section, you can select the conditions under which there will be a KPI threshold violation.
- The "Check for Alerts" option specifies how frequently the Alert condition is checked.
- When the frequency is set to Hourly, you can use the Check Every option to further define a time interval in multiple hours - for example, set the alert to run every 4 Hours.
- When the frequency is set to Daily, you can specify the exact time and timezone when the alert condition is checked.
- When the frequency is set to Weekly or Monthly, you can similarly specify the exact day of week or day of month, time, and timezone for the alert
- The "Analysis Window" option is the time period over which the KPI value used to trigger the alert is calculated.
- The "Check for Alerts" option specifies how frequently the Alert condition is checked.
- The Notification section is where you can specify the subject of the alert email, and also select the users who will receive alert notifications. Notifications are sent both via e-mail and in-platform.
Configuring Data Latency Monitoring Alerts
Data Latency Alerts enable you to monitor latency of multiple data streams.
NOTE: Data Latency Alerts can be set up by users. In addition, Sight Machine offers Automated Production Latency Alerting that are set up automatically in the platform by default.
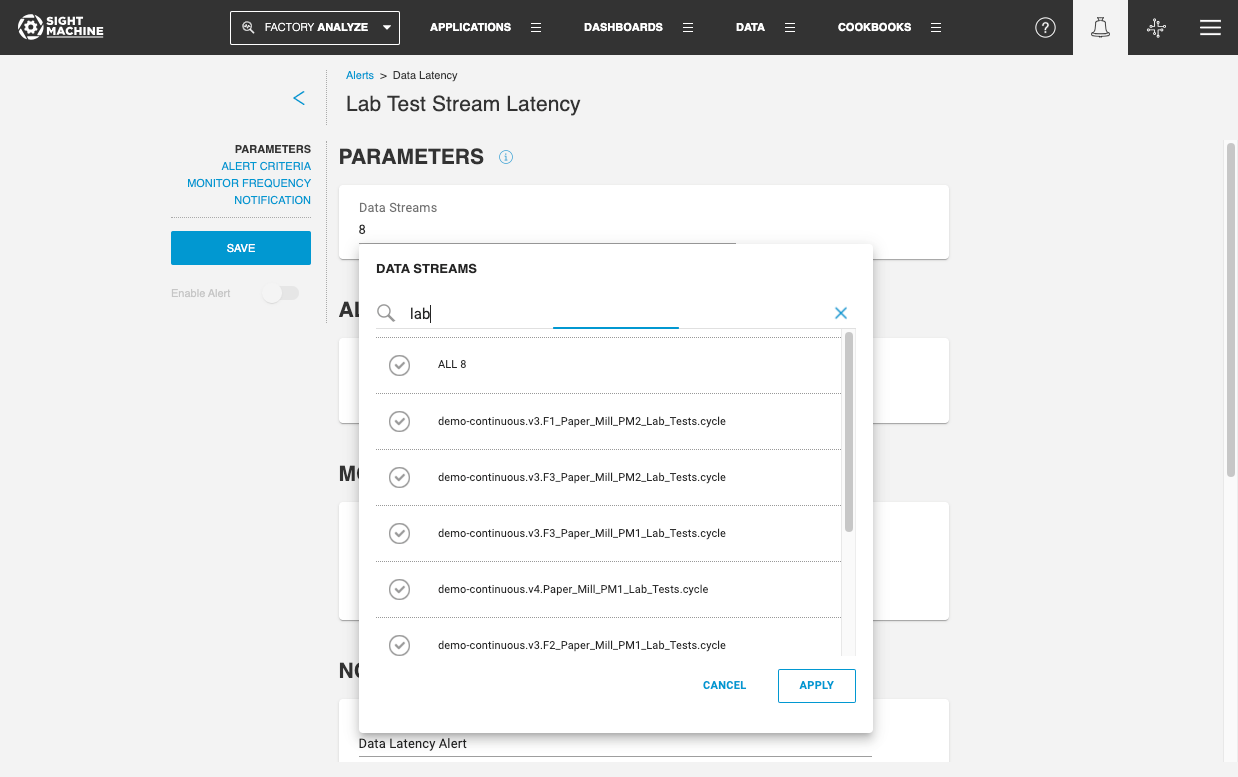
- From the Alerts page, click on Create new Alert -> Data Latency
- Select the data streams that you want to monitor. You can use wildcard search to find specific data streams critical to your process and proactively monitor them.
- Set your data latency alert criteria. An incident is triggered if data from the selected sources has not arrived in the Sight Machine environment in more than the time specified. For example - When the Notify me when the data is late by is set to "1 Day", the alert will trigger if the data is late by more than 1 day.
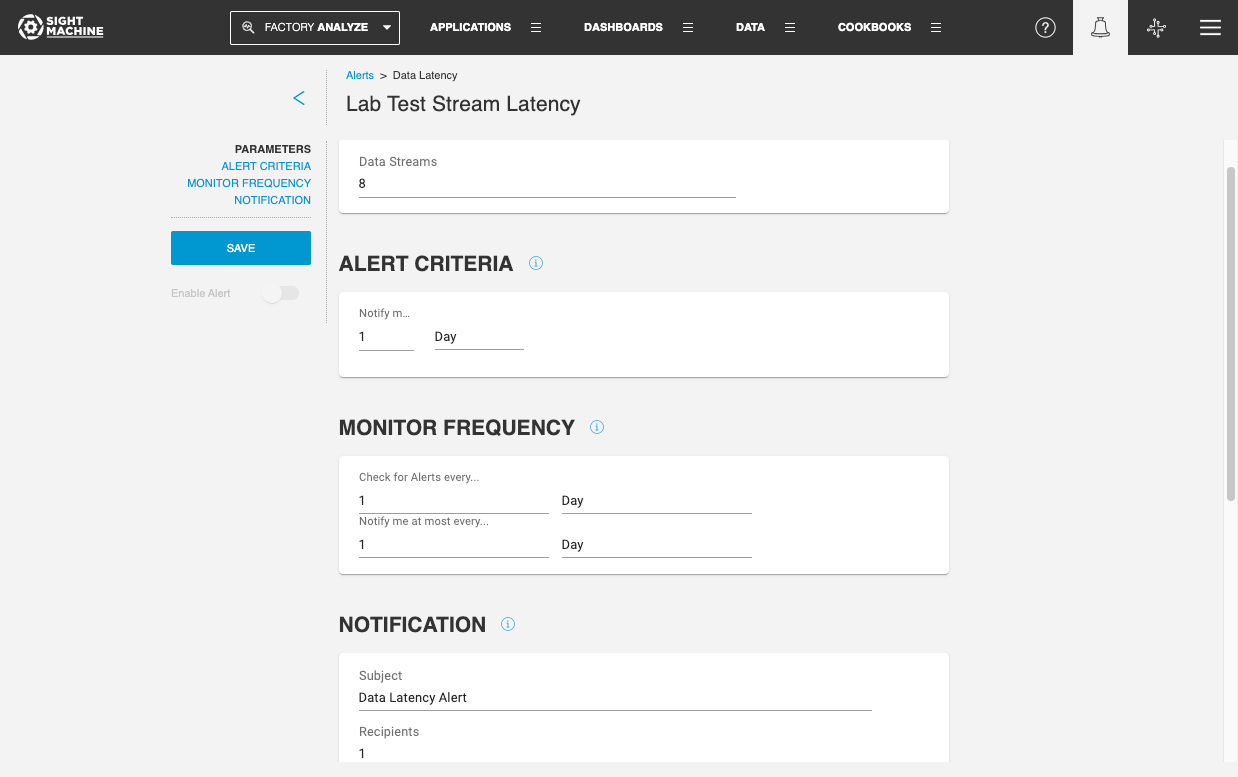
- Specify the frequency at which the alert is checked, as well as the notification frequency, in the Monitor Frequency section.
- Check for alerts every... is the frequency at which the alert condition is checked. This can be in Minutes, Hours, or Days. For example, if this is set to 1 Day, the alert condition is checked once every day, in the 24-hour period starting from the time at which the alert was created.
- Notify me at most every...is the frequency of how often a notification is sent when the alert condition is met. This can be in Minutes, Hours, or Days. You may want to check the alert every Hour, but only be notified once a day.
- Specify alert notification details such as Email Subject and email recipients in the The Notification section. Notifications are sent both via e-mail and in-platform. Alert recipients must be users in Sight Machine; external email IDs are not supported.
Glossary
Alert: The specific configuration of parameters and criteria set to monitor a data stream.
Incident: A specific instance or event where the data meets or exceeds the configured alert criteria.
Notification: The automated email or in-platform message sent to designated recipients when an incident occurs.
Analysis Window: The specific duration of time (e.g., 1 hour, 1 day) over which a KPI value is calculated to determine if a threshold has been violated.
Monitor Frequency: How often the system runs the analysis to check for new incidents (e.g., checking for breaches every 15 minutes).
Notification Frequency: The setting that limits how often a user is contacted (e.g., "Notify me at most every 1 day" prevents repeated emails for the same ongoing issue).
Data Latency: The delay between when data is generated at the source and when it arrives in the Sight Machine environment.
Specification Limits (Upper/Lower): The defined numeric boundaries for a process; values falling outside these "Spec Limits" trigger an SPC alert.
Subgroup: A collection of data points grouped by time or count used in SPC charts to calculate averages or ranges.
Monitor By: A configuration field in KPI alerts that defines the granularity of the calculation (e.g., by Machine, Shift, or Factory).
Feature Benefits
Automated Incident Detection: Monitors live data streams to automatically trigger Incidents the moment specific criteria are met, ensuring no critical event goes unnoticed.
Statistical Process Control (SPC) Monitoring: Enables precise quality control by monitoring for breaches in both upper and lower specification limits, helping to maintain product consistency and reduce scrap.
Multi-Level KPI Oversight: Allows for the tracking of Key Performance Indicators across multiple granularities, from individual Machines and Lines up to the Process Area and Plant levels.
System Health & Connectivity Assurance: Features Data Latency Monitoring and Automated Production Latency alerts to detect outages in source data connectivity, ensuring that your data-driven decisions are based on the most current information.
Targeted Notification System: Streamlines communication by sending Notifications only when an incident occurs, reducing "alarm fatigue" and ensuring that the right people receive actionable information at the right time.
Summary
Intelligent Alerting transforms the Sight Machine platform from a passive data repository into an active operational assistant. By configuring Alerts based on quality (SPC), performance (KPI), or system health (Latency), users can ensure that every Incident is captured and communicated via a Notification.
Whether you are using manual configurations to monitor specific line-level KPIs or leveraging Automated Production Latency to safeguard data flow, this feature ensures that operational issues are identified and addressed with minimal delay, maintaining high standards of efficiency and uptime across the facility.