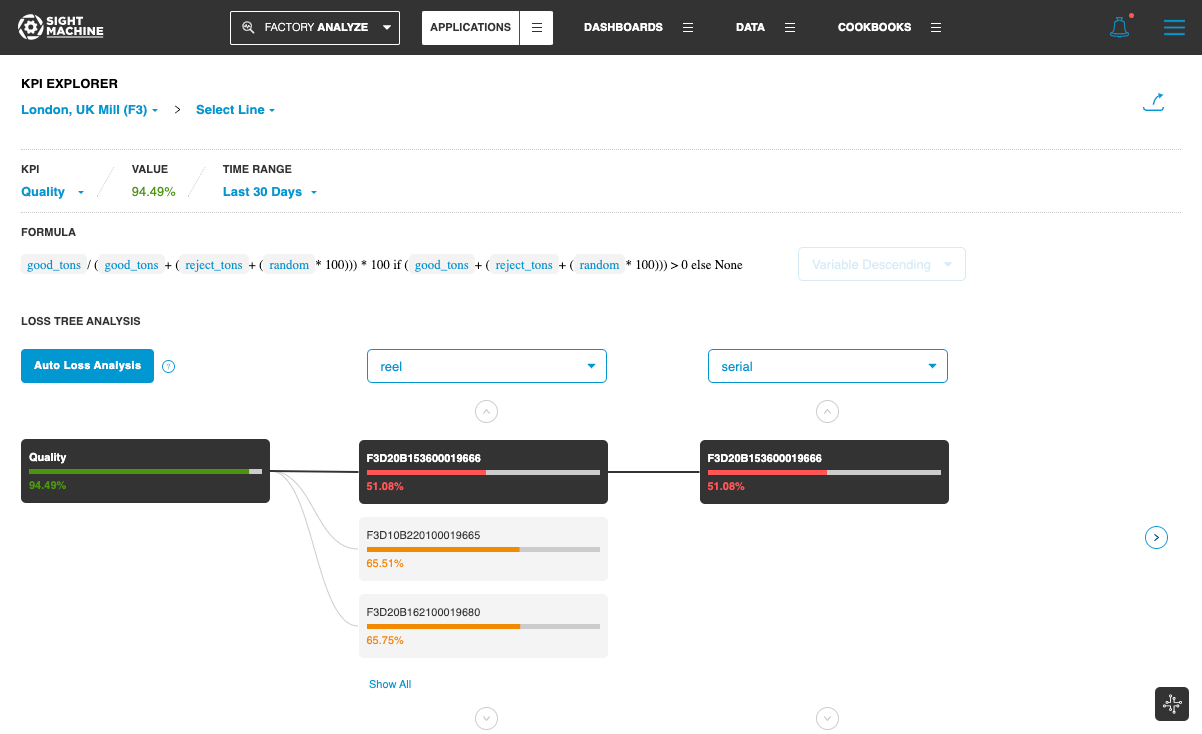
KPI Explorer is a loss analysis tool in Factory ANALYZE that enables you to drill down into KPIs and understand related losses. With a few simple actions, you can identify the lowest performing metrics for each KPI, visually color-coded, and automatically presented in ranked order of the largest to smallest loss.
To access KPI Explorer, from the list of KPIs on the Facility card, click the KPI that you want to explore.
After you launch the tool, you can drill down interactively to identify losses that are related to the selected KPI. You can click Add a Breakdown, or click the progress bar style KPI value to break it down.
At each drill-down, Sight Machine automatically surfaces the 3 least optimal KPI values for the selected breakdown parameter. This lets you quickly identify the largest loss areas at a glance and answer questions such as Which Machine/Shift/Defect Reason contributed the most to the Scrap rate over the last 24 hours?.
The color-coding of each metric on the Homepage, as well as within the KPI Explorer lets you easily identify if a metric is above target, acceptable, or below target.
You can also launch the KPI Explorer by clicking Visit Facility first, and then selecting a KPI from the Line or Machine cards in the Facility view.
You can also launch the KPI Explorer from the Applications menu, in the category Data Exploration.