Lever Insights enables process engineering teams to easily determine the relative importance of each lever in the Cookbook. It uses the AI algorithm Random Forest to detect non-linear, multivariate relationships between levers and customer KPIs
To access this tool, navigate to any Cookbook that has been deployed, and then click Deployed Recipes. The Levers section of the Deployed Recipes provides a link to the interactive Lever Insights tool.

Lever Insights provides automated insights by analyzing historical run data of your production process, and generating an interest score for each Cookbook lever. This score lets you identify the impact of each lever on the production outcomes that are selected.
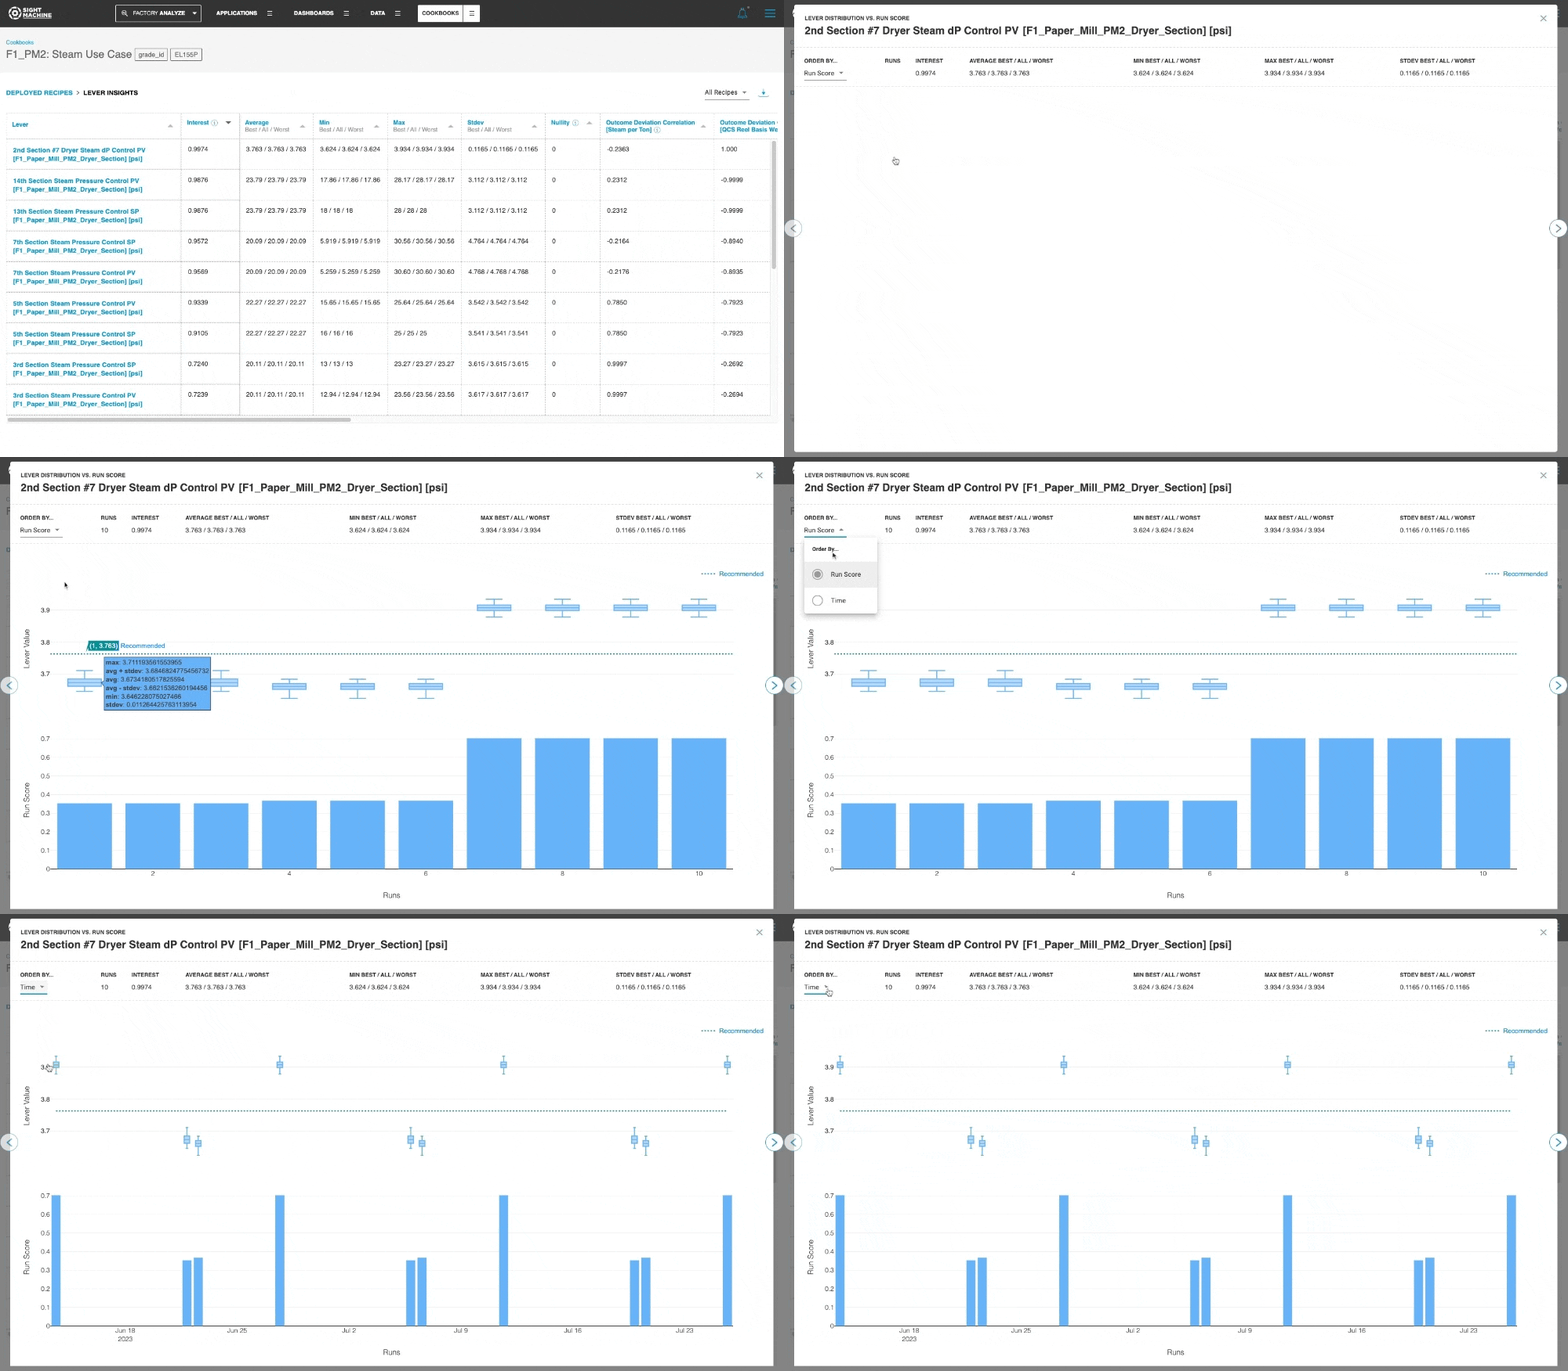
The Lever Insights table presents all levers in the Cookbook, ranked in order of the highest interest score.
.png)
The interest score is computed using a statistical algorithm that uses correlation coefficients of the following:
Average lever value with each outcome value
Lever deviation from the recommended value with outcome values
Average lever value with run scores
Lever deviation from the recommended value with run scores
The algorithm also accounts for sparse lever or outcome data points by excluding null values from the underlying data set, and ensures that the score is based on valid data values.
The individual correlation scores are displayed in the Lever Insights table. Refer to the tooltip description for more details on how each score is calculated.
You can visualize the statistical properties for each lever by clicking a property name in the Lever Insights table.

The visualization shows a box plot of the lever value for each run, with the recommended value shown for reference. Click the Order by option to switch the chart and show the lever value against time, instead of runs.
.png)