- Print
- DarkLight
Product Updates - February 2022
- Print
- DarkLight
Overview of Changes
| Component | Notes |
|---|---|
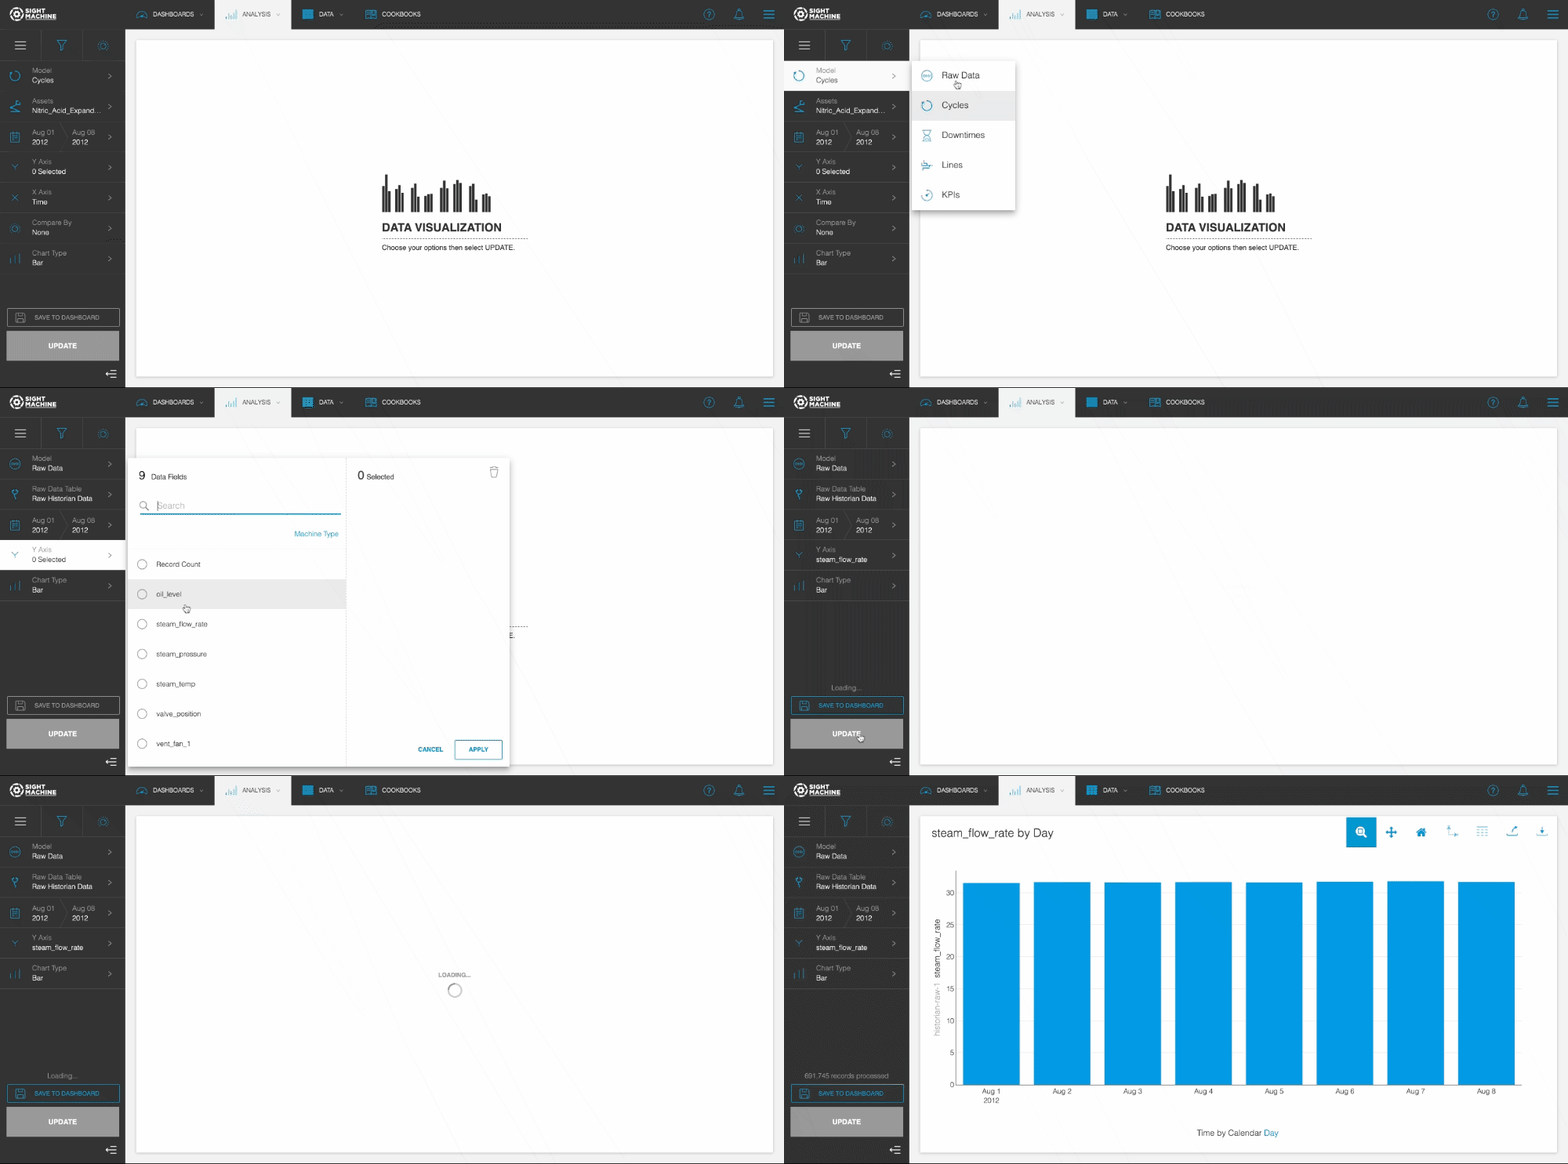
| Data Visualization: Raw Data model | You can analyze raw data and validate data quality with the Raw Data model now available in the Data Visualization application. See Raw Data Analysis in Data Visualization. |
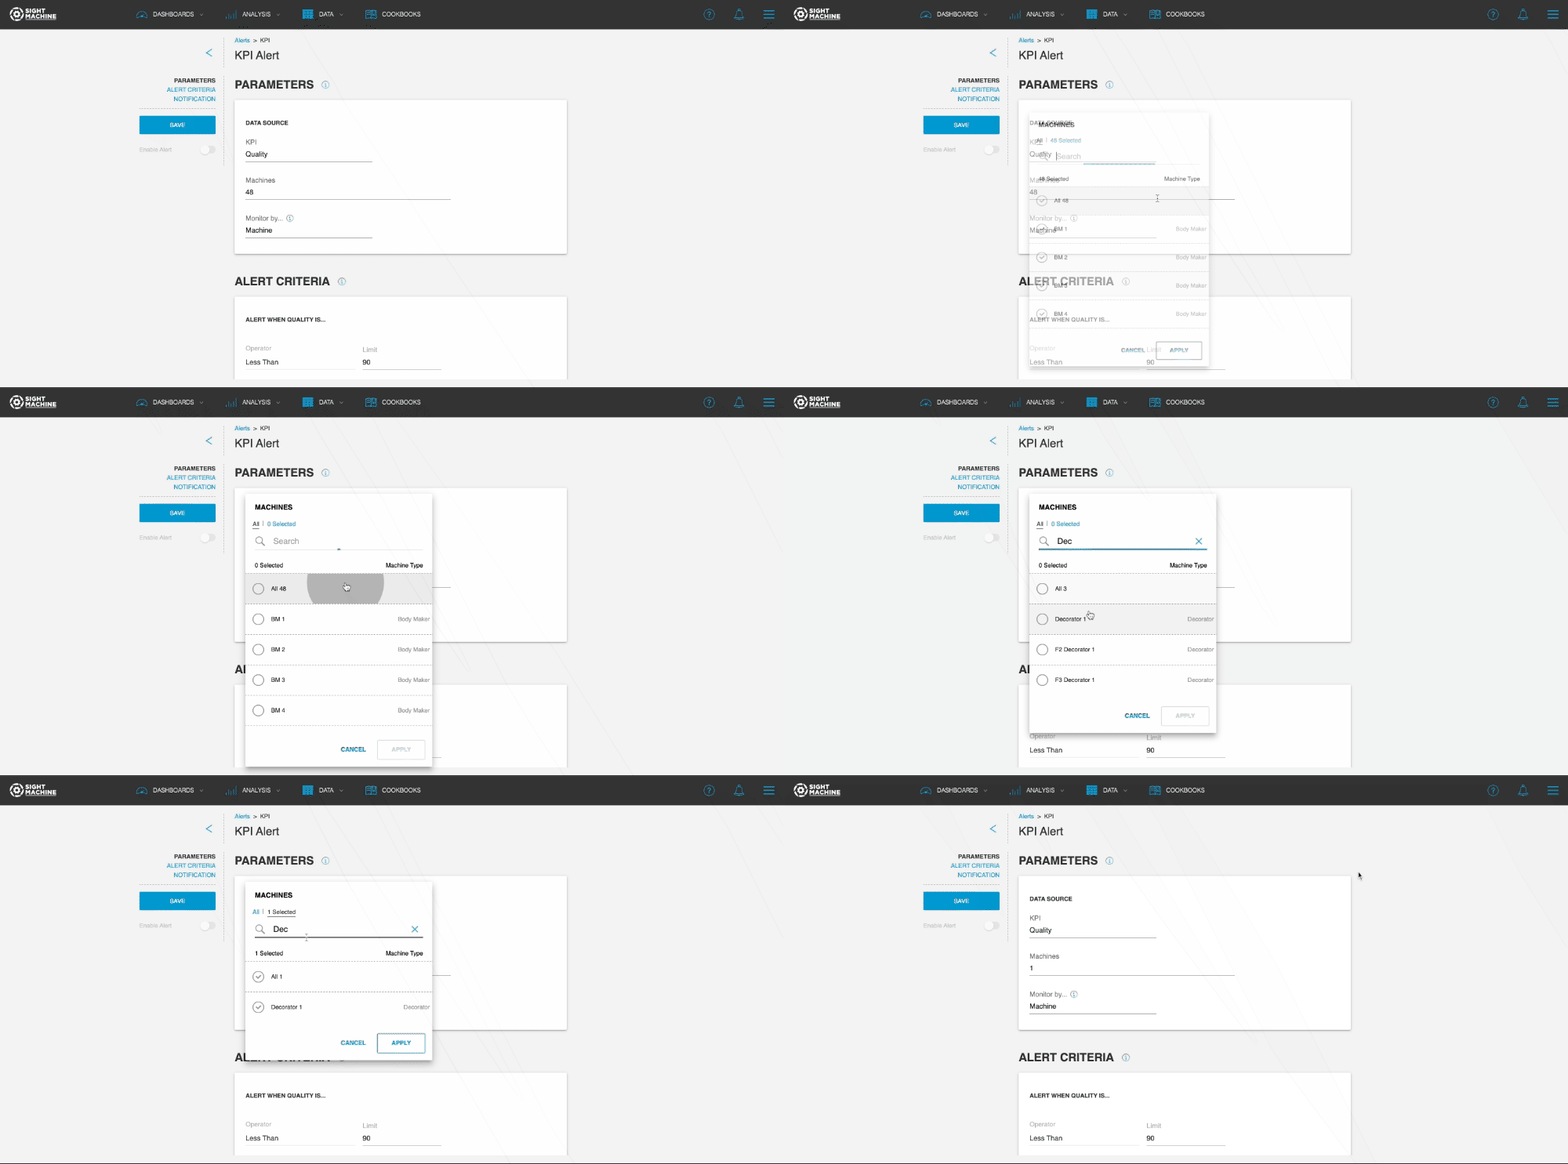
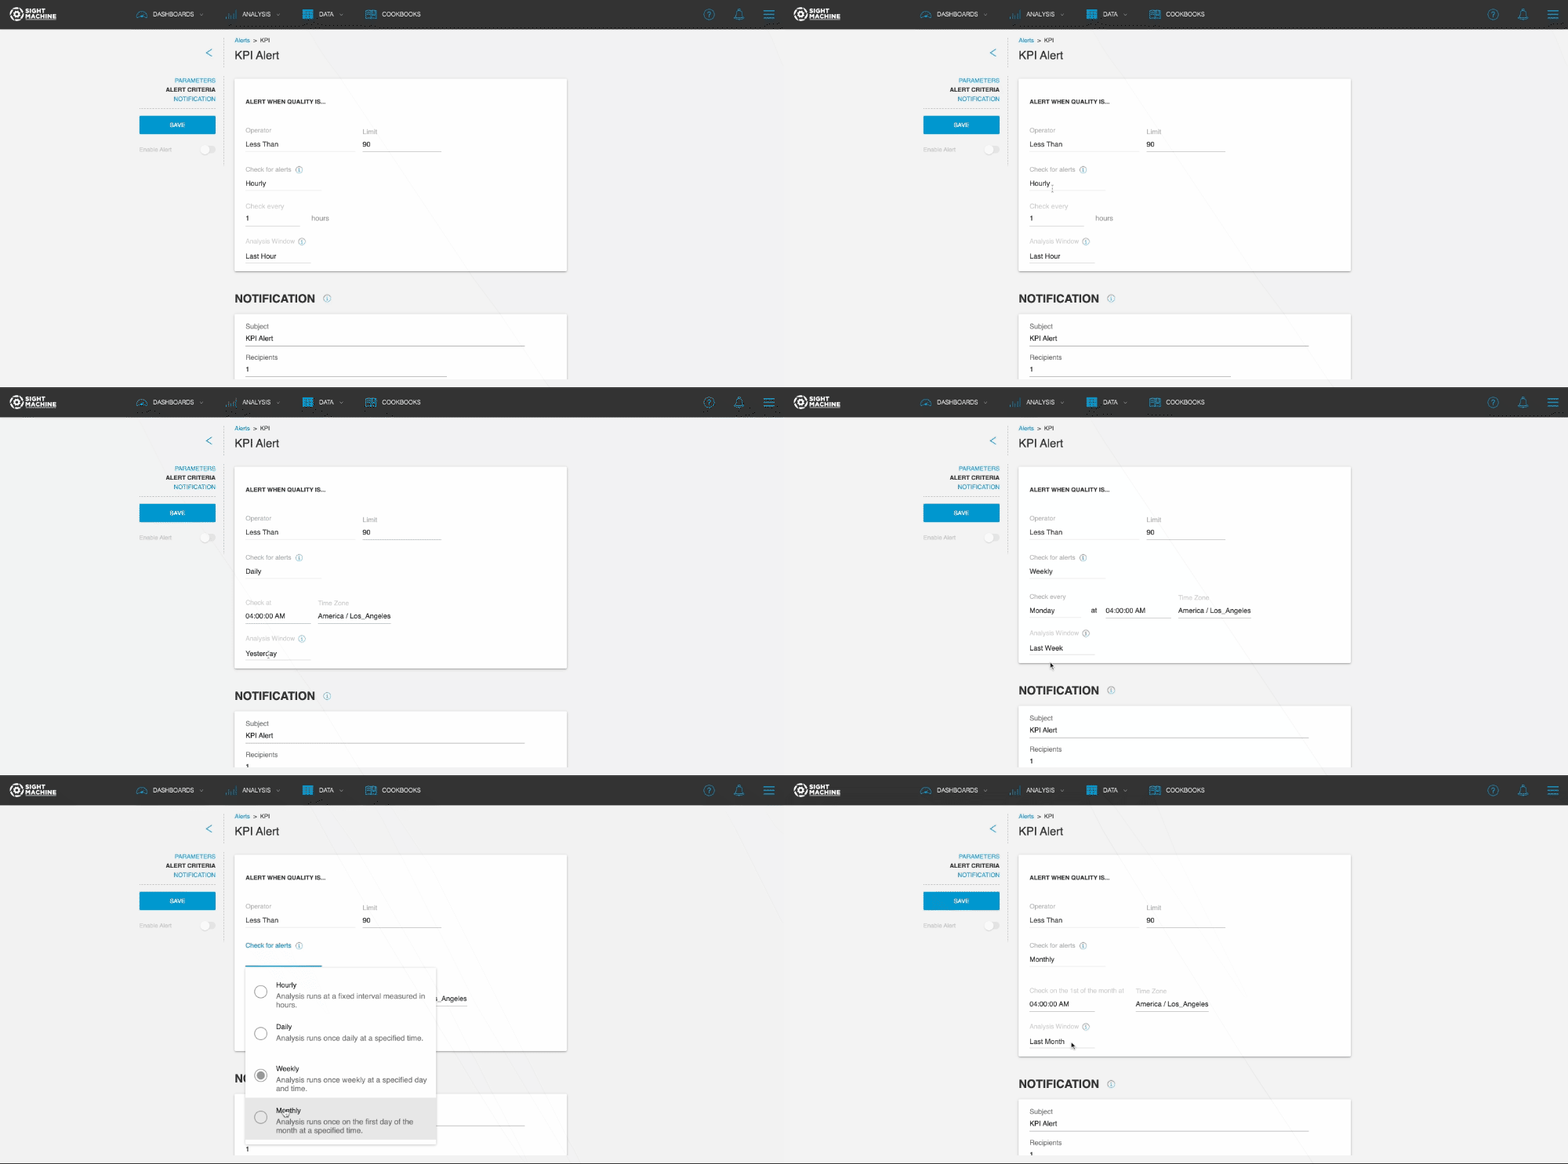
| KPI Alert | Configuring KPI Alerts is now easier with a number of usability enhancements. See Usability Enhancements for KPI Alerting. |
Raw Data Analysis in Data Visualization
You can analyze raw data and validate data quality with all of the features available in the Data Visualization application. The Raw Data model is now available in Data Visualization for:
- Basic Users with All Facilities access
- Developers
- Administrators

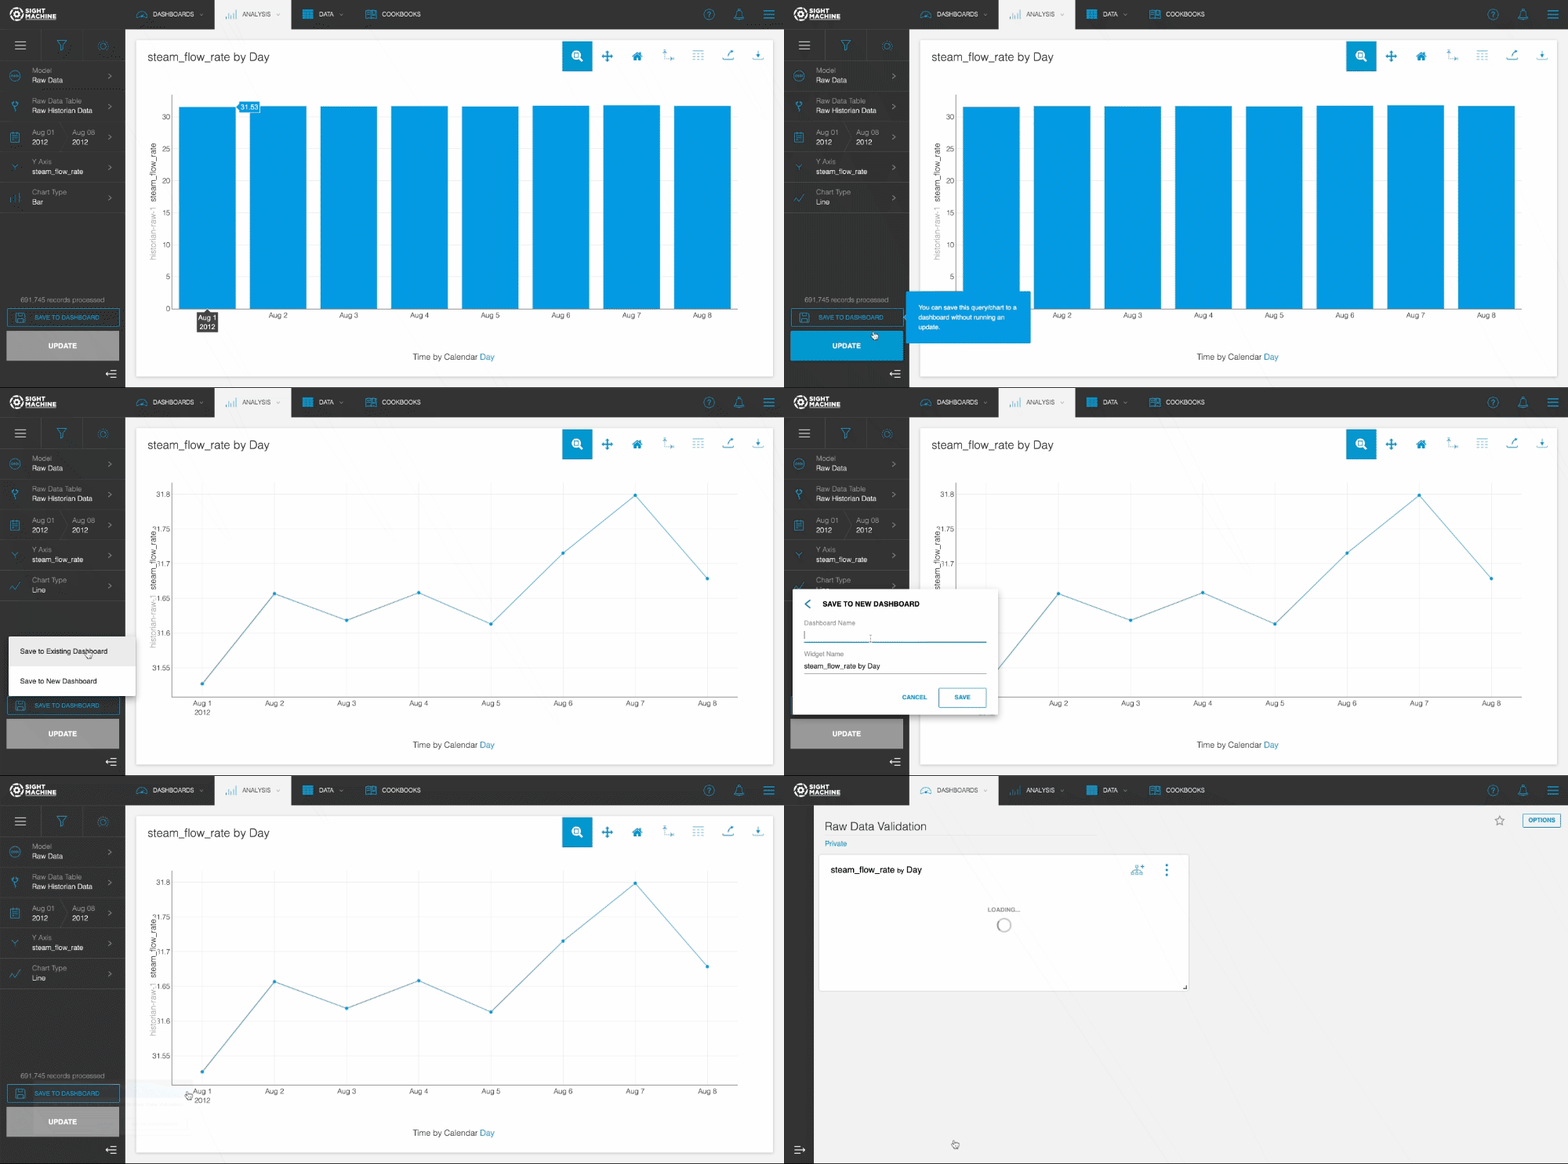
Like all analysis conducted Data Visualization, results can be displayed with selectable chart types and chart configurations, shared with colleagues for collaboration, and saved to dashboards for quick retrieval.

Raw data visualization currently supports time-series charts only (with Time on the X axis); however, future enhancements may include a user-selectable X axis.
NOTE: If you want to access the Raw Data model in Data Visualization, the environment must be running V3 of The Manufacturing Data Pipeline.
Coming Soon: There are a number of enhancements to raw data analysis coming soon. Enhancements include:
- Raw data analysis across raw data tables
- Improved error handling for access control errors
- Sunset for the Raw Data Visualization application
Usability Enhancements for KPI Alerting
KPI Alert configuration is now easier with the following usability enhancements:
- Selecting machines to monitor now supports search, select all, and a tab to identify the selected machines.

- The Monitor by configuration now supports search.
- Analysis windows now contain defaults based on the selected alert schedule.


