Overview of Changes
| Component | Notes |
|---|---|
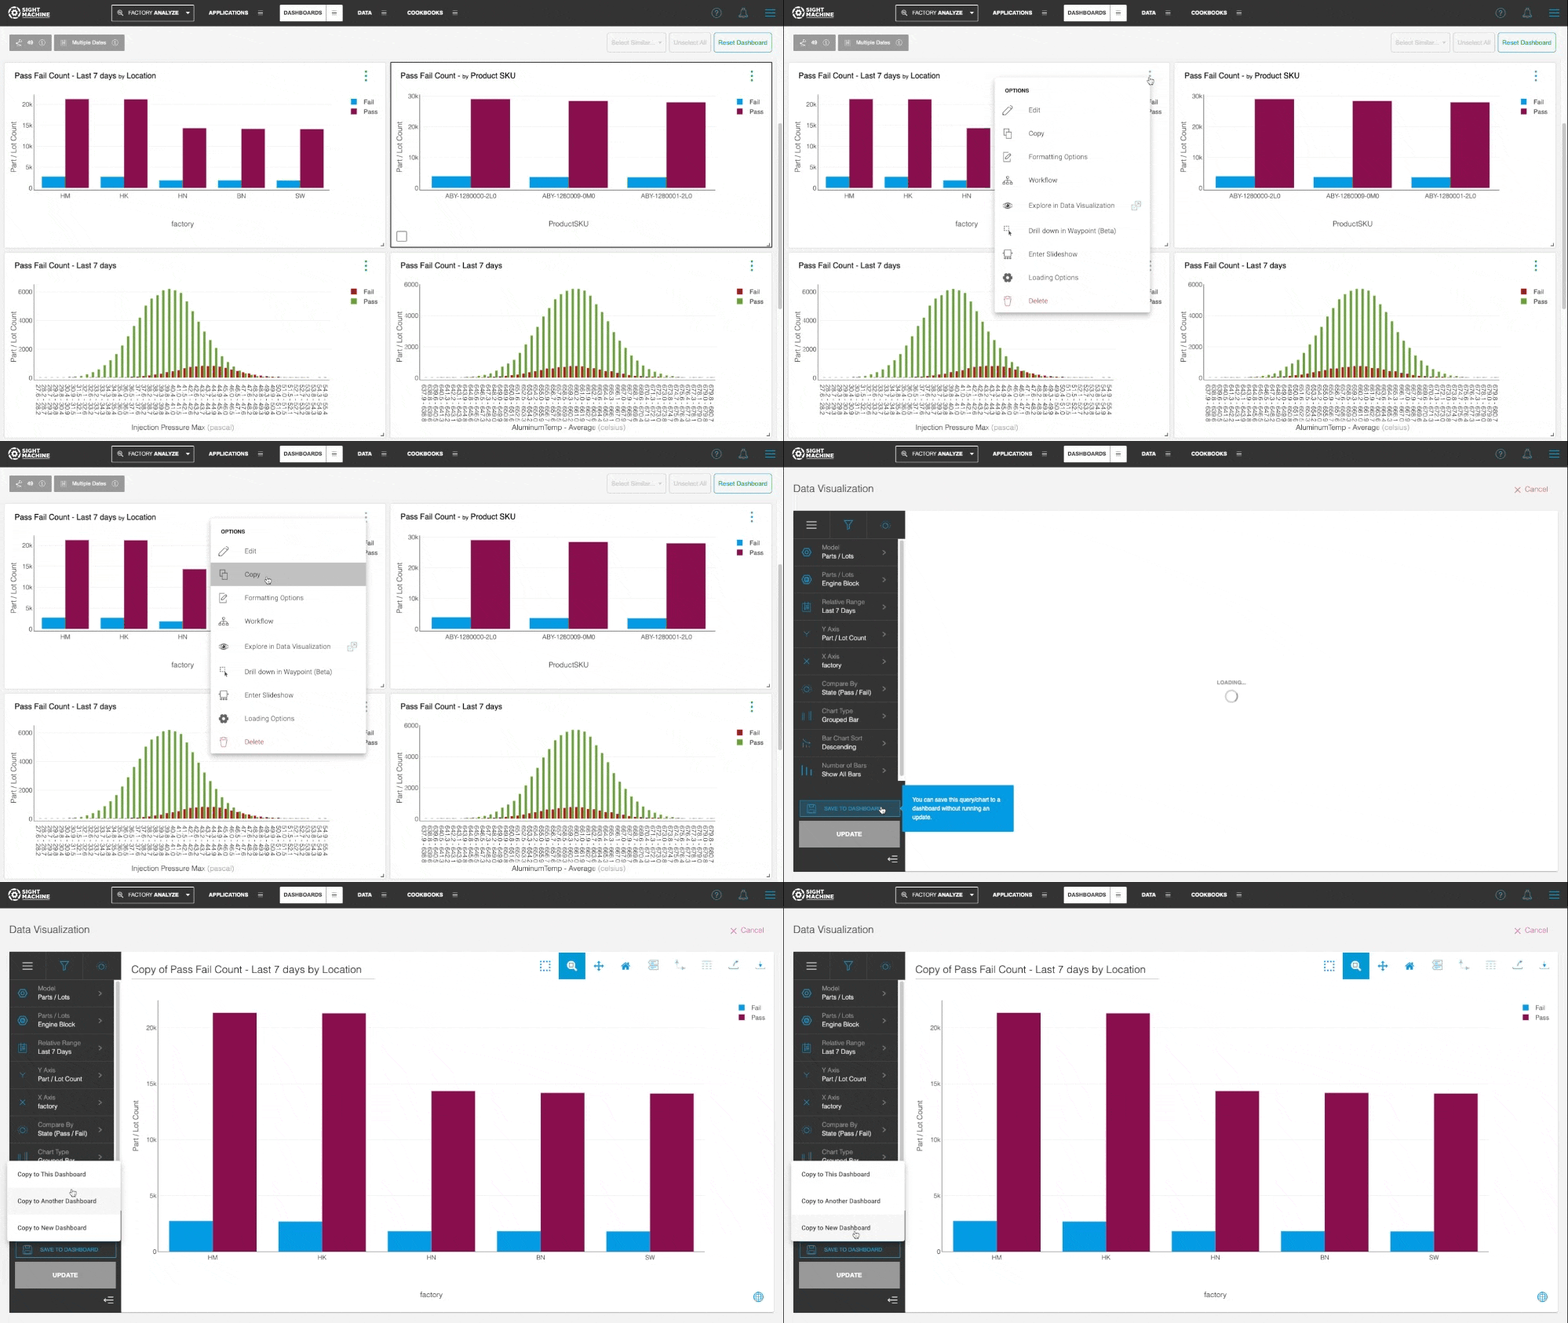
| Widgets | You can now copy dashboard widgets to the current dashboard, another existing dashboard, or a new dashboard. See Copying Widgets Across Dashboards. |
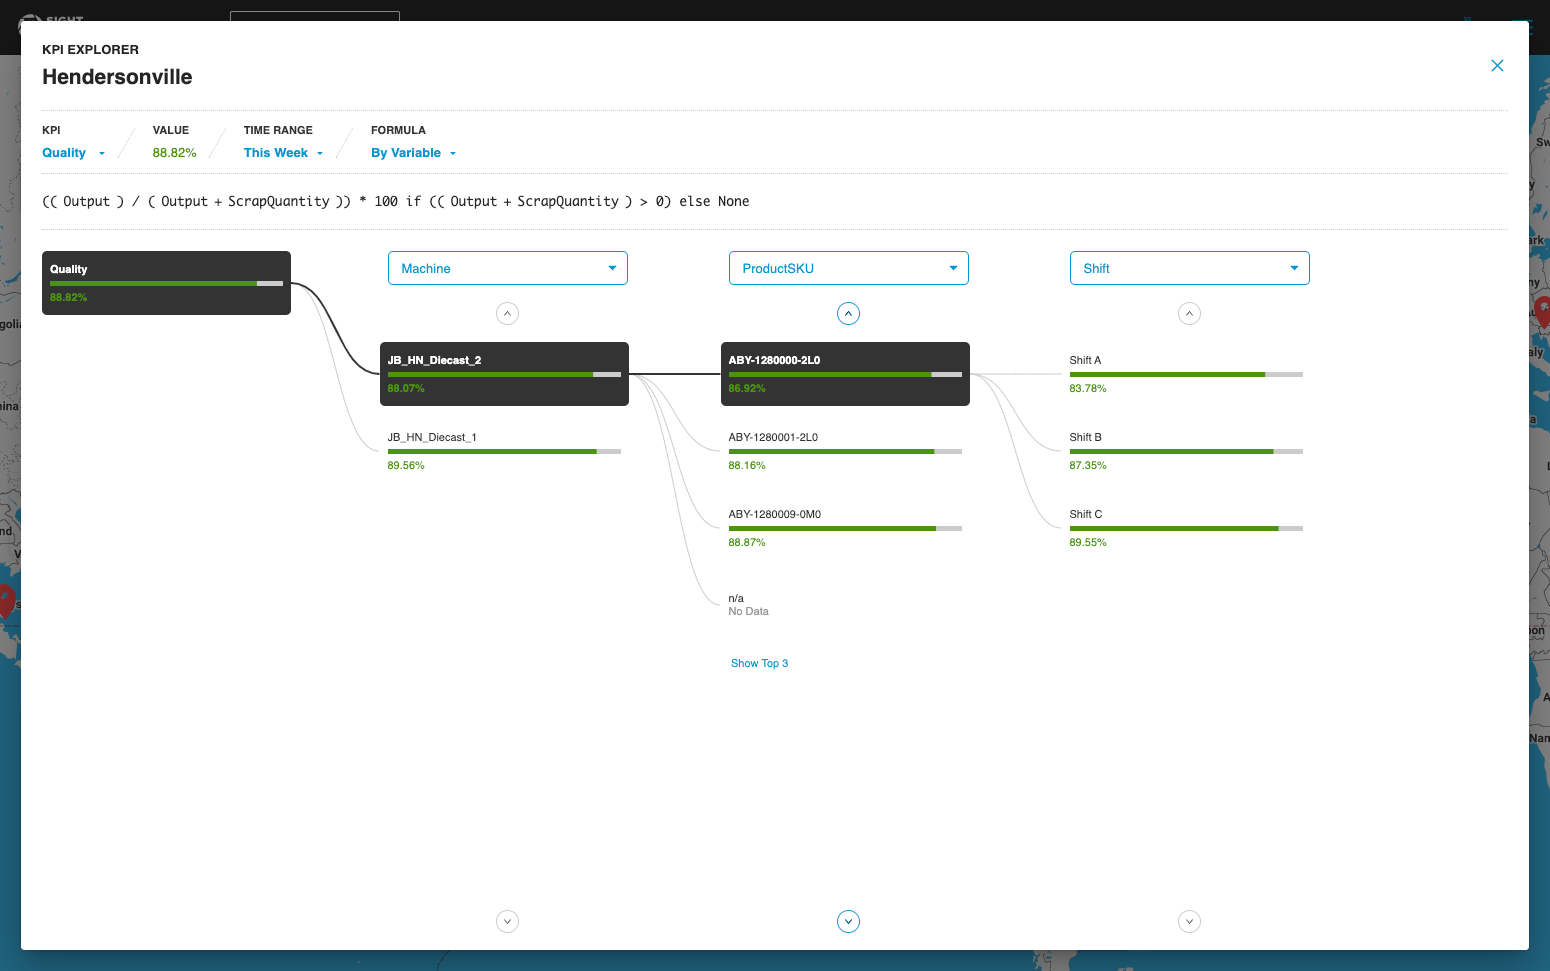
| KPI Explorer | KPI Explorer now ranks the results of all KPI drill-downs in the order of “least optimal” to “most optimal” values, enabling you to quickly identify the biggest losses. See KPI Explorer: Drill-Down Sort Order. |
| Dashboards | Application widgets on Dashboards now include the Formatting Options menu, which lets you display Titles and change title text size for improved readability. See Dashboards: Formatting Options. |
| Platform | This release also contains a number of bug fixes and minor improvements. See Updates/Fixes. |
Copying Widgets Across Dashboards
You can now copy widgets to the current dashboard, another existing dashboard, or a new dashboard. From the overflow menu on the widget, click Options > Copy. Then click Save to Dashboard to see the options for the destination Dashboard.
You can select any of the following options:
- Copy to This Dashboard
- Copy to Another Dashboard
- Copy to New Dashboard

KPI Explorer: Drill-Down Sort Order
KPI Explorer now ranks the results of all KPI drill-downs in the order of “least optimal” to “most optimal” values. This lets you identify the lowest performing metrics at a glance.
As a result, KPIs with positive directionality in the configuration (for example, % Quality, where higher values are better), are now presented in ascending order. Conversely, KPIs with negative directionality (for example, Scrap rate, where lower values are better) are now presented in descending order.

Dashboards: Formatting Options
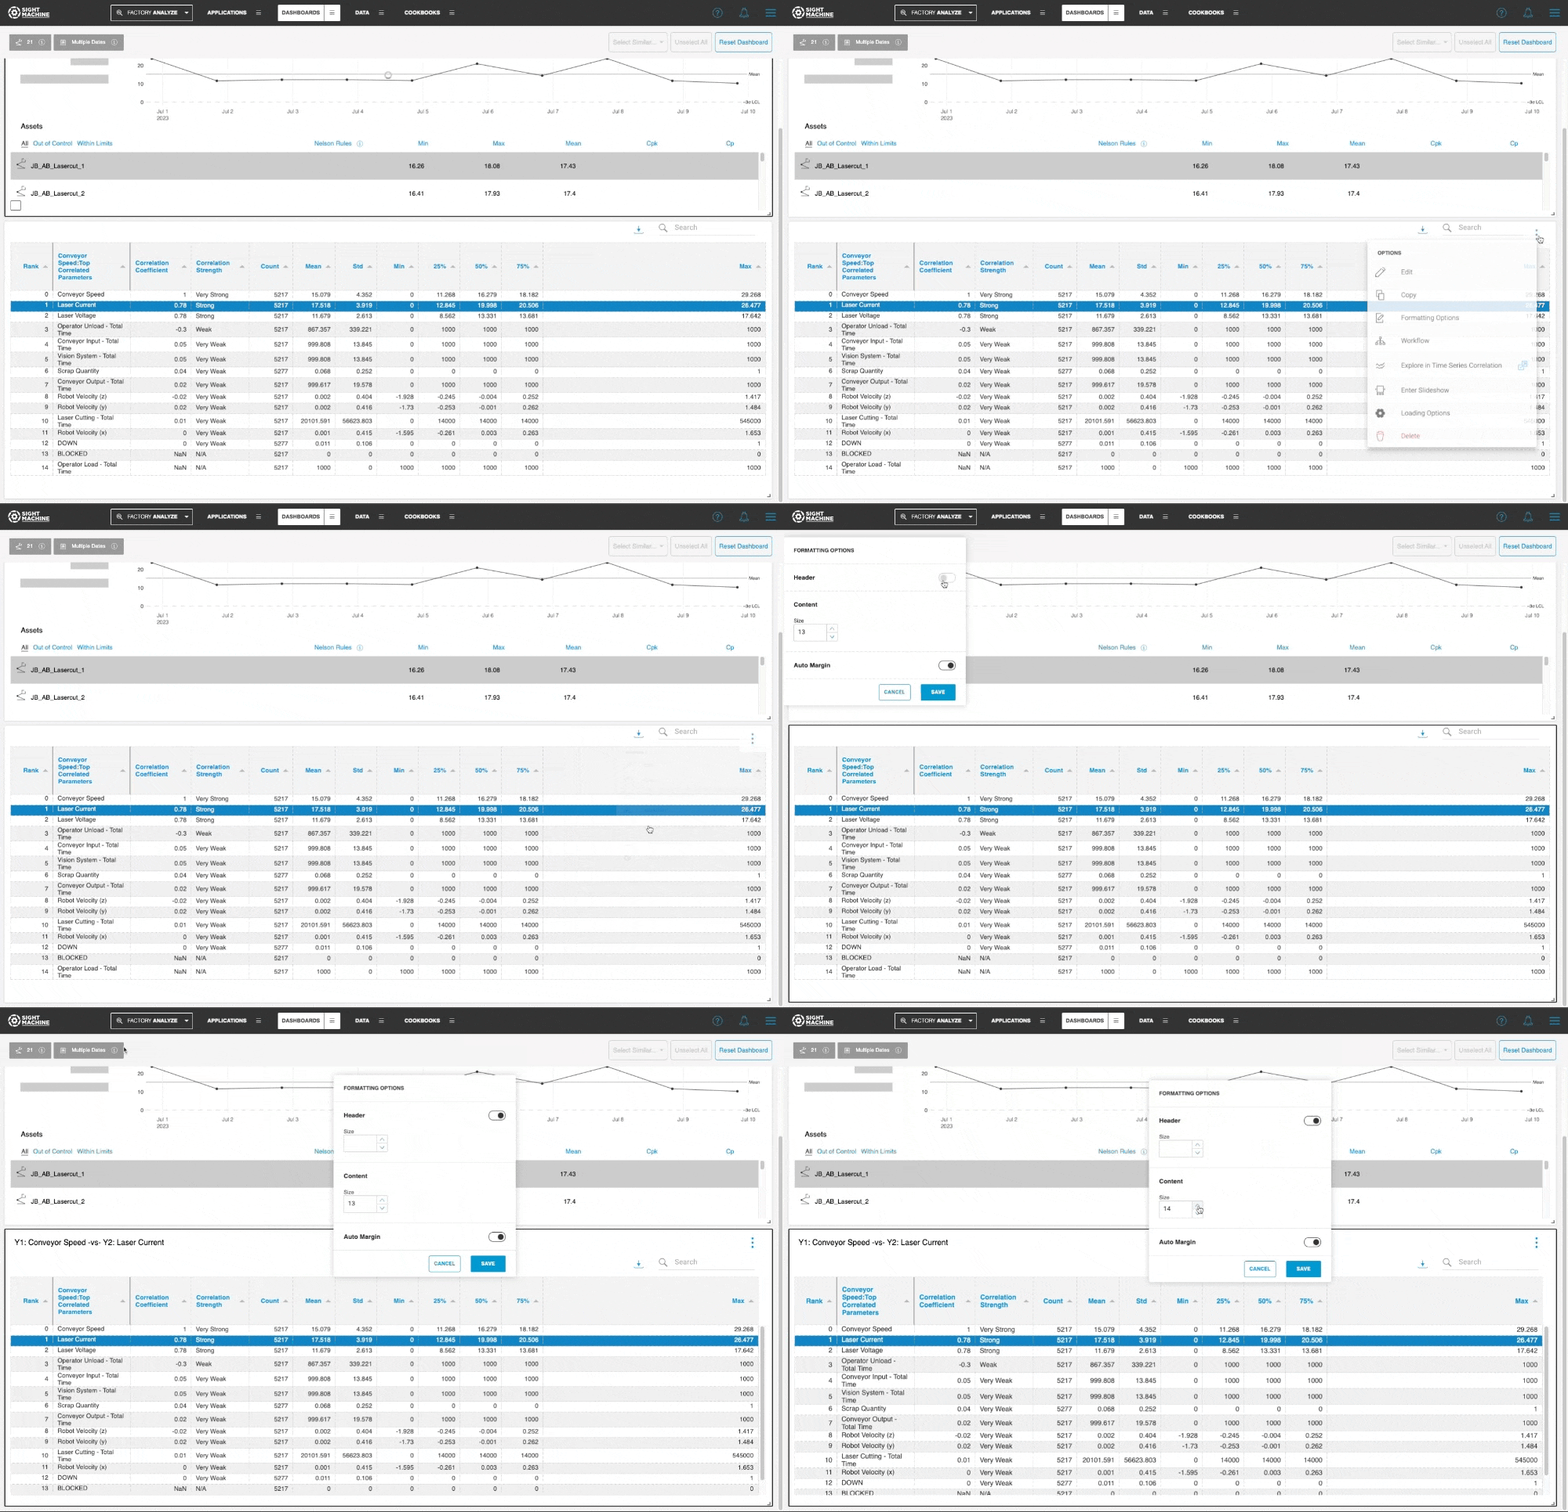
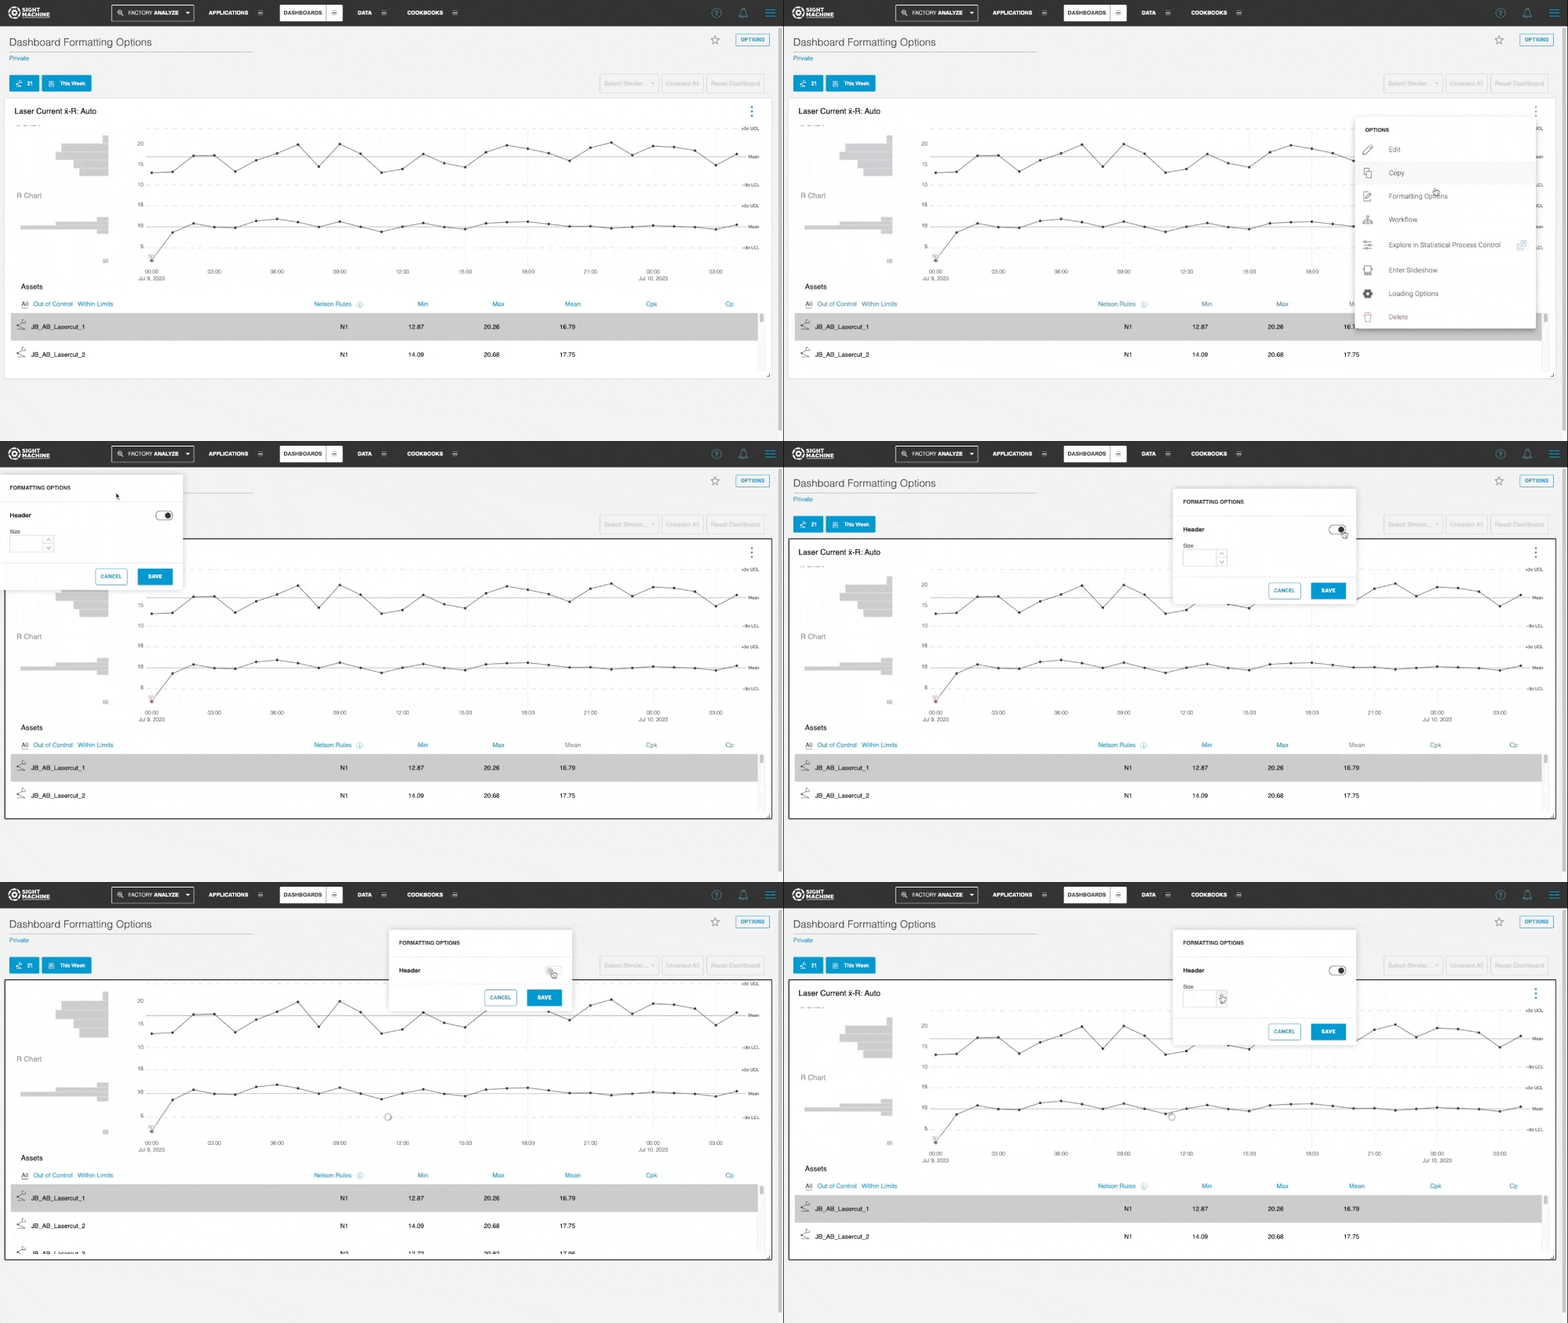
All Applications now have Formatting Options available from the overflow menu on the Dashboard. To access these options, including the ability to hide and modify the font size of widget titles for improved readability, go to the overflow menu, and then click Formatting Options.
The list of supported Applications include the following:
- Time Series Correlation
- Correlation Heatmap
- Curve Fit Analysis
- Statistical Process Control
- Descriptive Statistics
- Variance Analysis
- Timeline Analysis
- Event Timeline
NOTE: Additional formatting options vary by Application.
Example 1: Formatting options for Time-Series Correlation

Example 2: Formatting options for Statistical Process Control

Updates/Fixes
- Pipeline Builder
- Improved syntax highlighting now highlights matching tokens inside strings (such as parentheses inside JSON strings in Expressions), and does not mark Jinja template syntax as invalid JSON.
- The Schema tables display a new column that indicates which fields in the Input Schema are removed by the operator and which fields in the Output Schema are added by the operator. This does not indicate fields that are changed or overwritten.
- Operator configurations support word wrap again. Word wrap was accidentally disabled as part of the recent conversion to the new JSON editor.
- Large numbers in the Details and Notes pane are now displayed with number separators.
- Disk utilization is now displayed in the Details and Notes pane.
- A bug that caused the platform to incorrectly check whether task slots are available was resolved.
- Tables used in dynamic operators are now significantly faster to use.
- Environment Builder
- A bug that prevented the EB empty state from displaying when a newly copied version’s pipeline had not yet been deployed was resolved.
- A visual bug that affected how the Line and Machine cards display was resolved.