Overview of Changes
| Component | Notes |
|---|---|
| Factory Analyze > KPI Explorer | KPI Explorer is a new feature in Factory Analyze that you can use to drill down into KPIs and view a KPI breakdown tree that automatically presents the lowest performing metrics and losses in ranked order. See KPI Explorer: New Feature. |
| Data Tables | Pareto charts now have options to show Top N data points and aggregate remaining bars. See Data Tables: Save to Dashboard. |
| Platform | This release also contains a number of bug fixes and minor improvements. See Updates/Fixes. |
KPI Explorer: New Feature
KPI Explorer is a new feature in Factory Analyze that you can use to drill down into KPIs and view a KPI breakdown tree that surfaces the lowest performing metrics and losses, automatically presented in ranked order.
To access KPI Explorer, on the Facility card on the Homepage, in the list of KPIs, click the KPI that you want to explore.
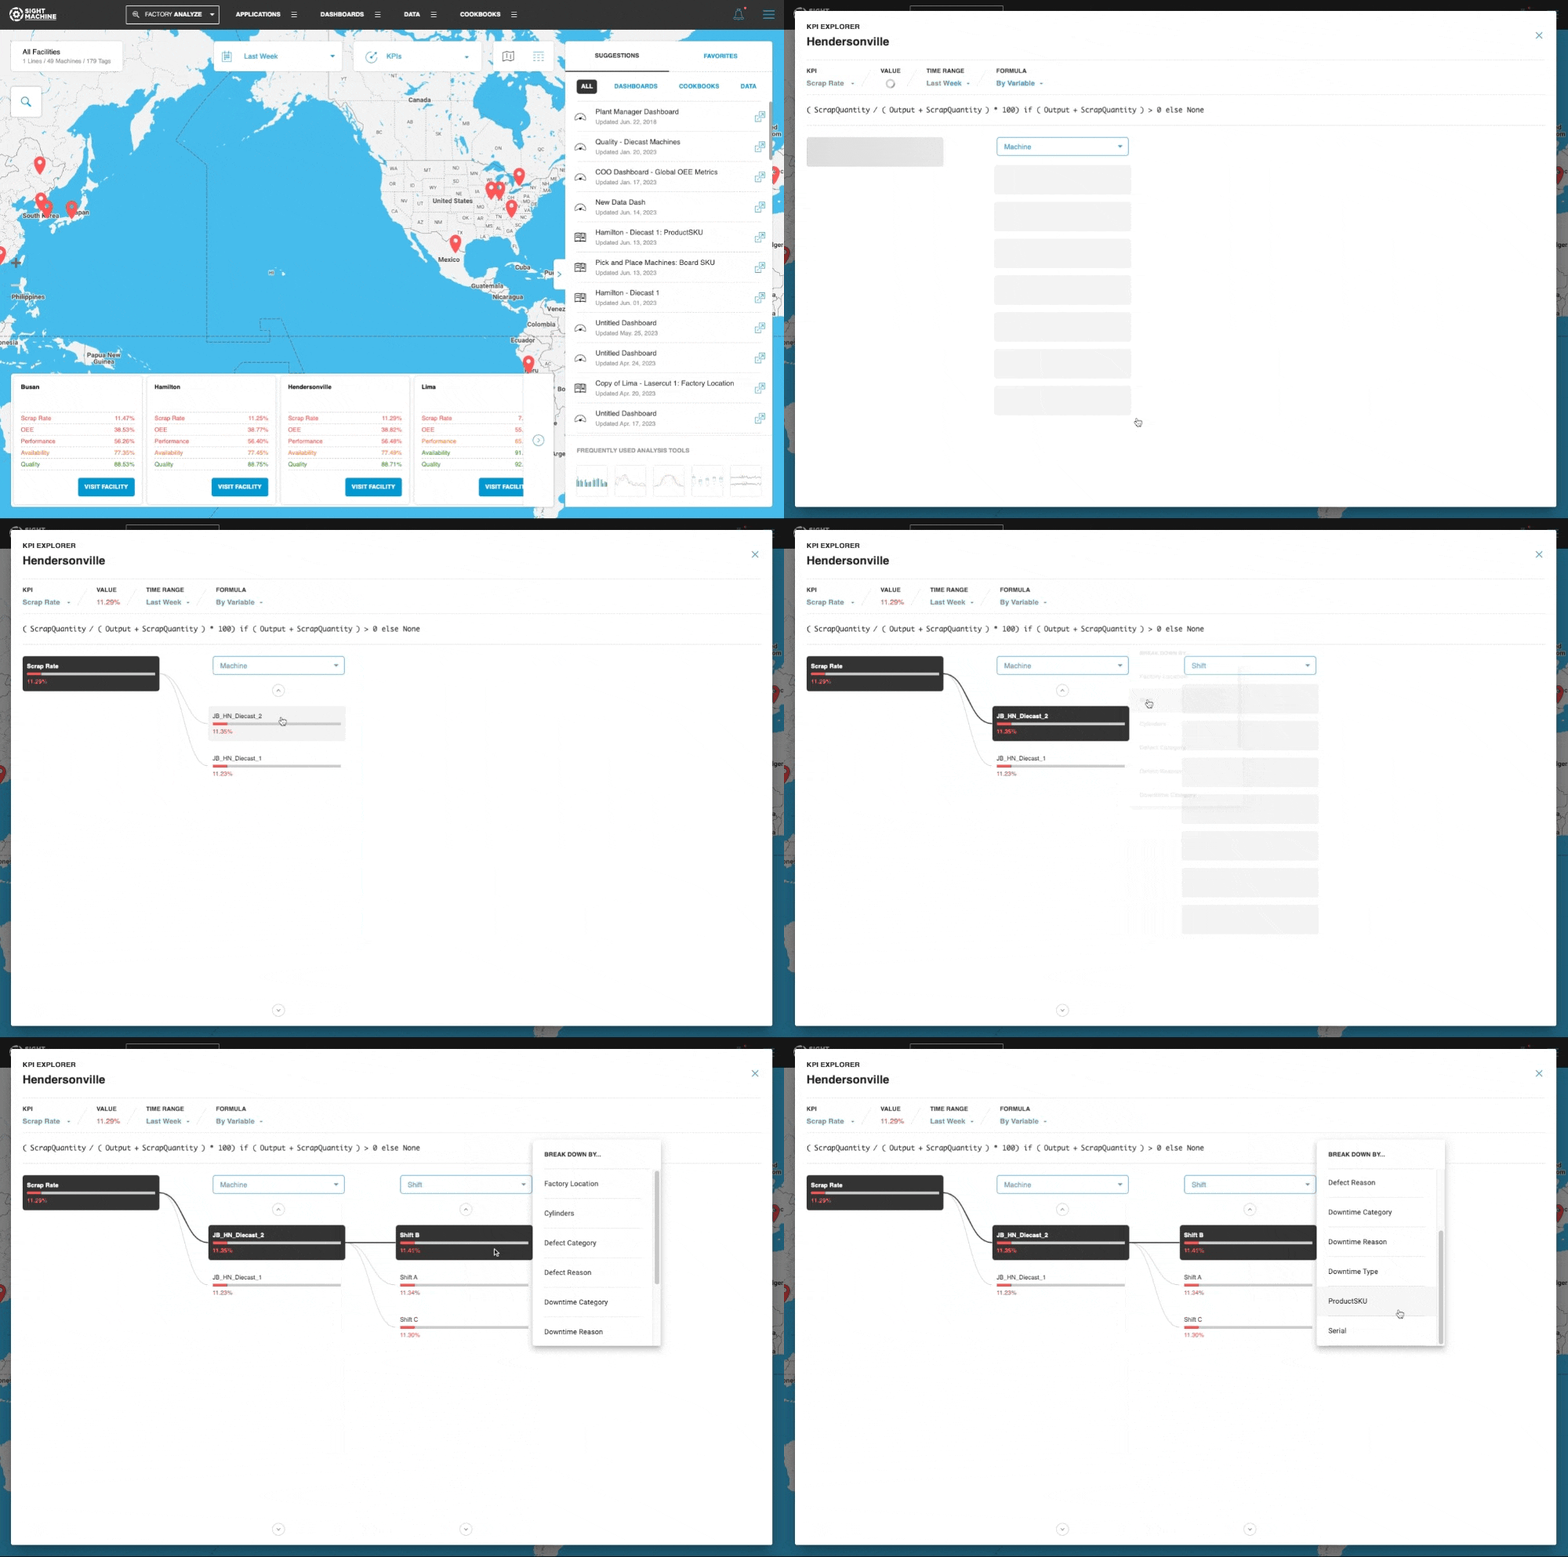
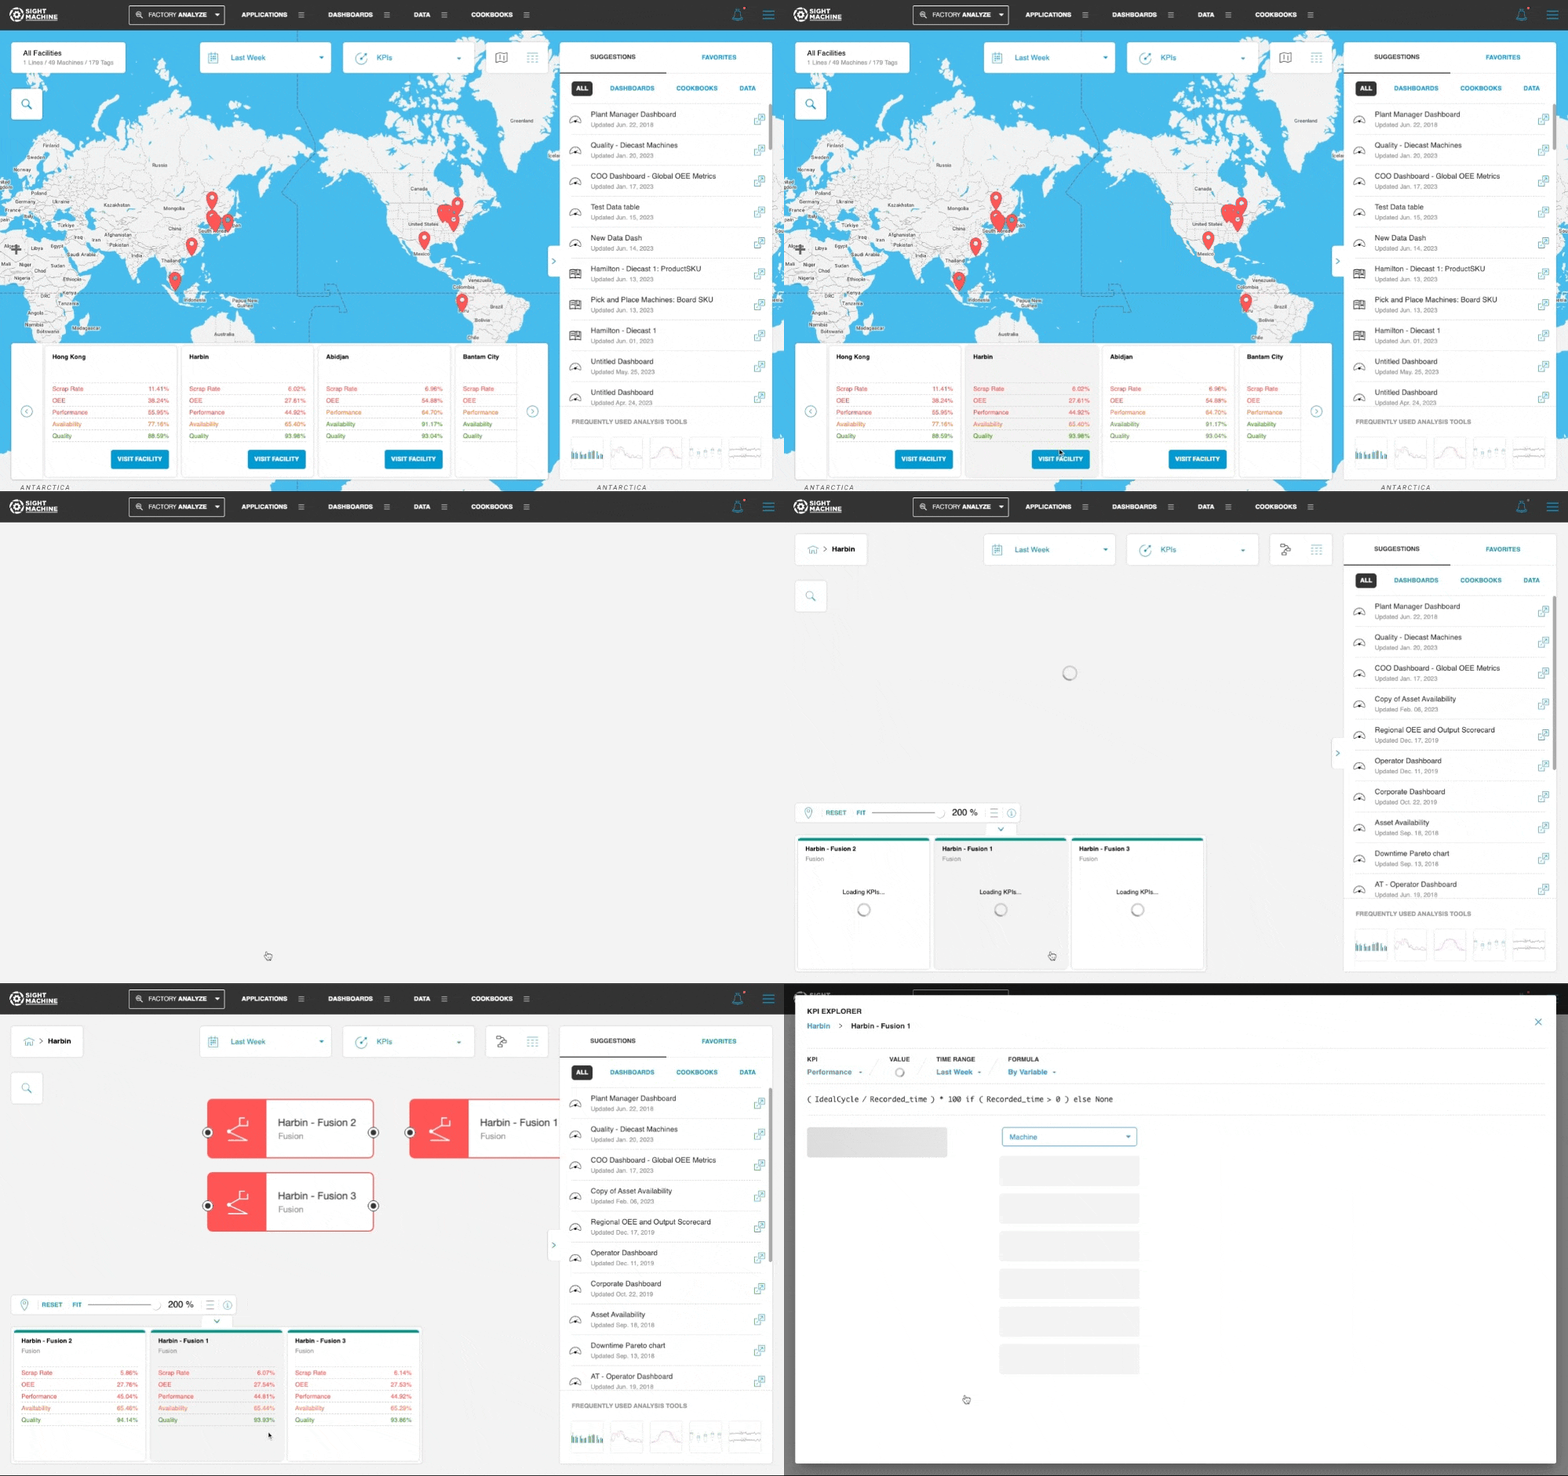
Alternatively, you can click Visit Facility first, and then from the Line or Machine card in Environment Builder, click the KPI that you want.
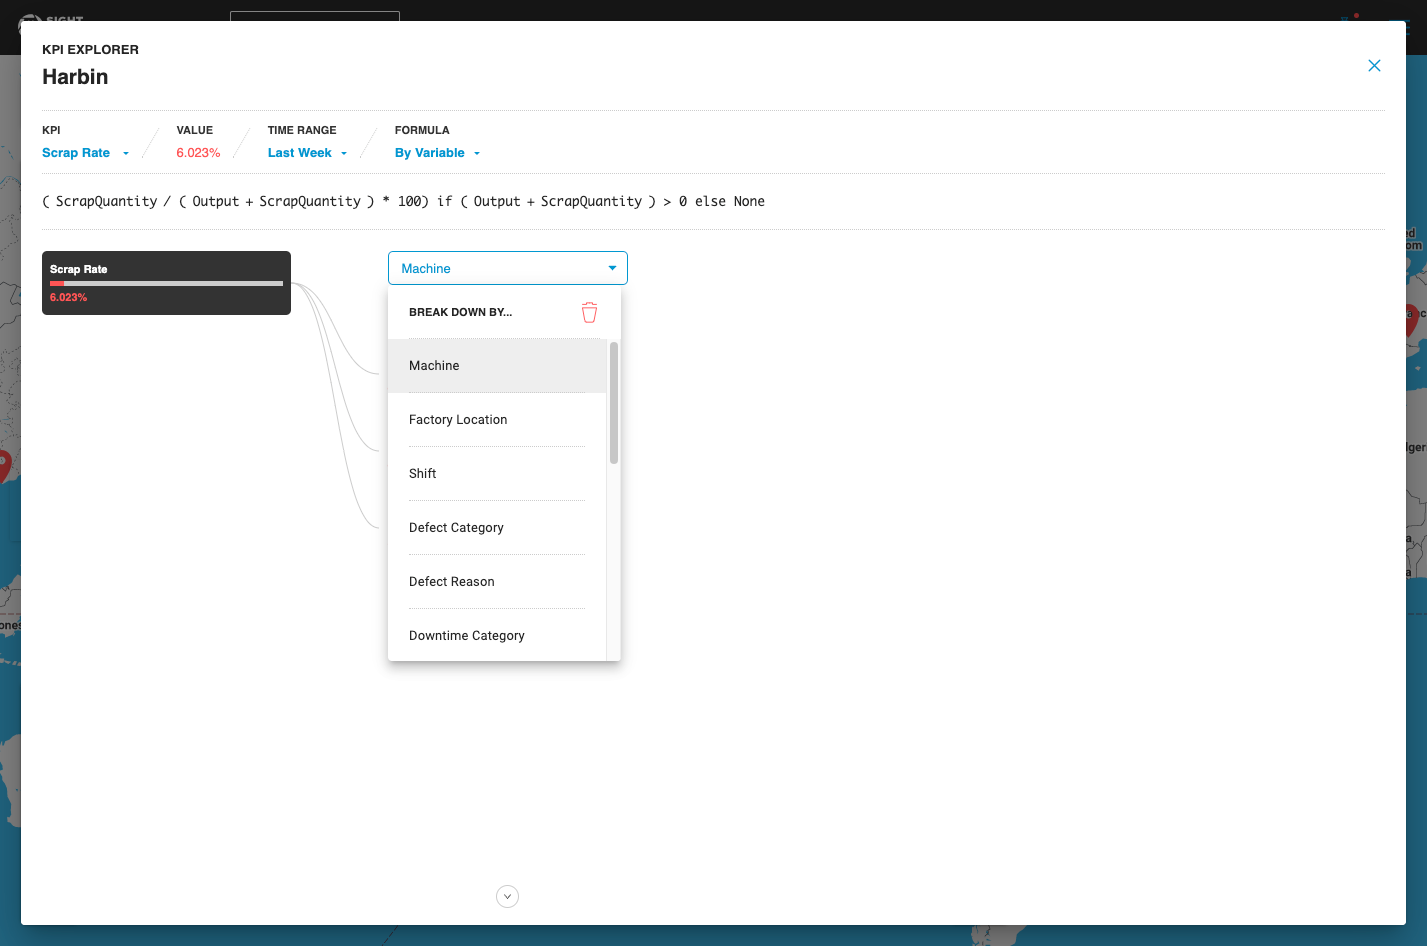
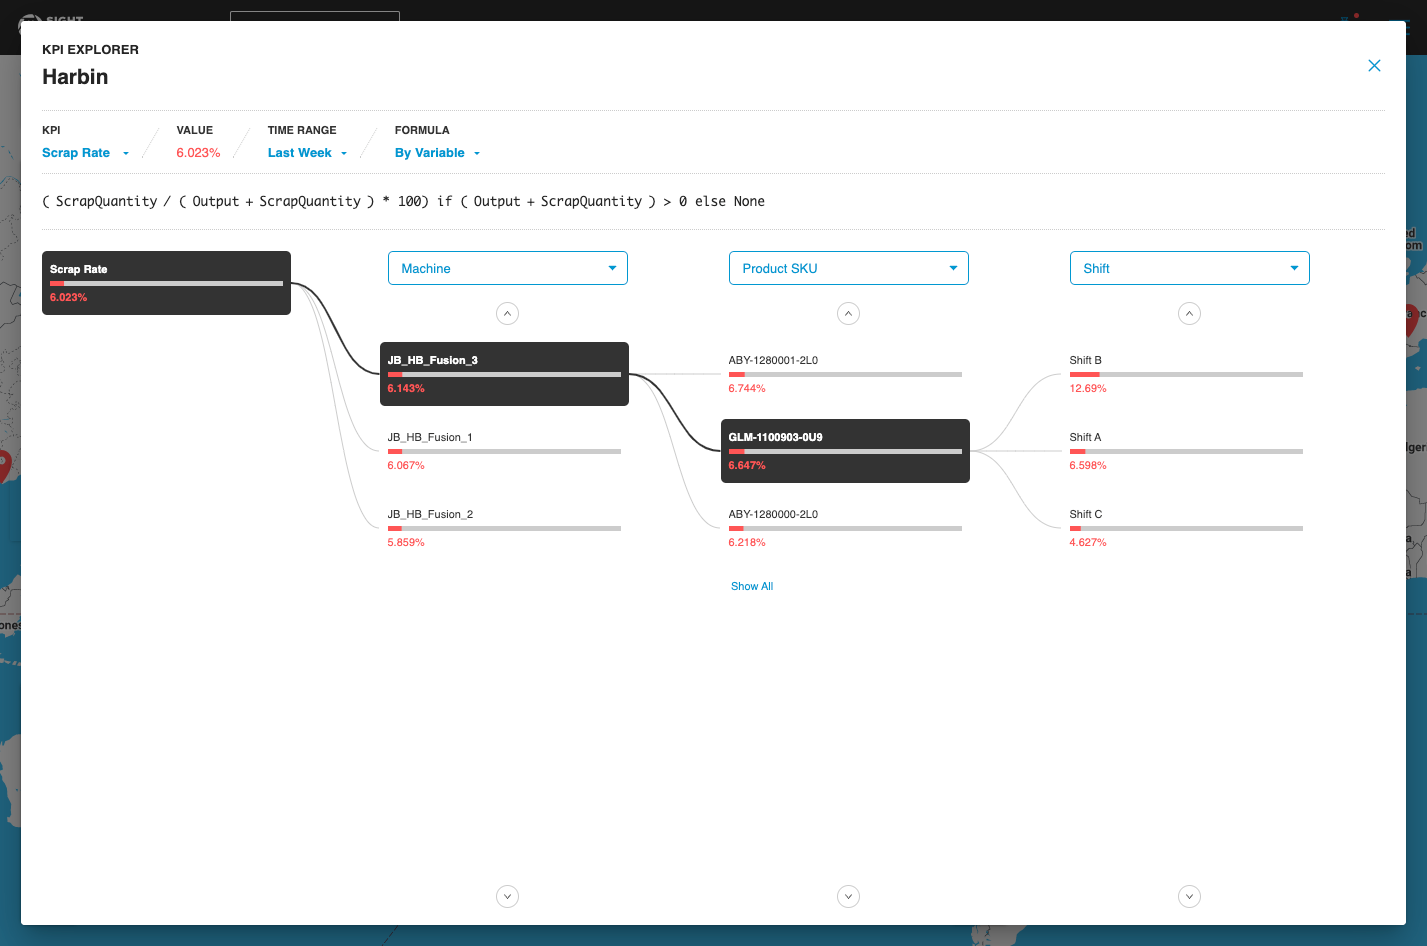
You can drill down into each KPI by clicking the progress bar that shows the KPI value, and then selecting a Breakdown variable from a list of options (for example, Machine, Shift, Defect Category, Defect Reason Code, Product SKU, etc.). All Categorical data fields are available as Breakdown variables.
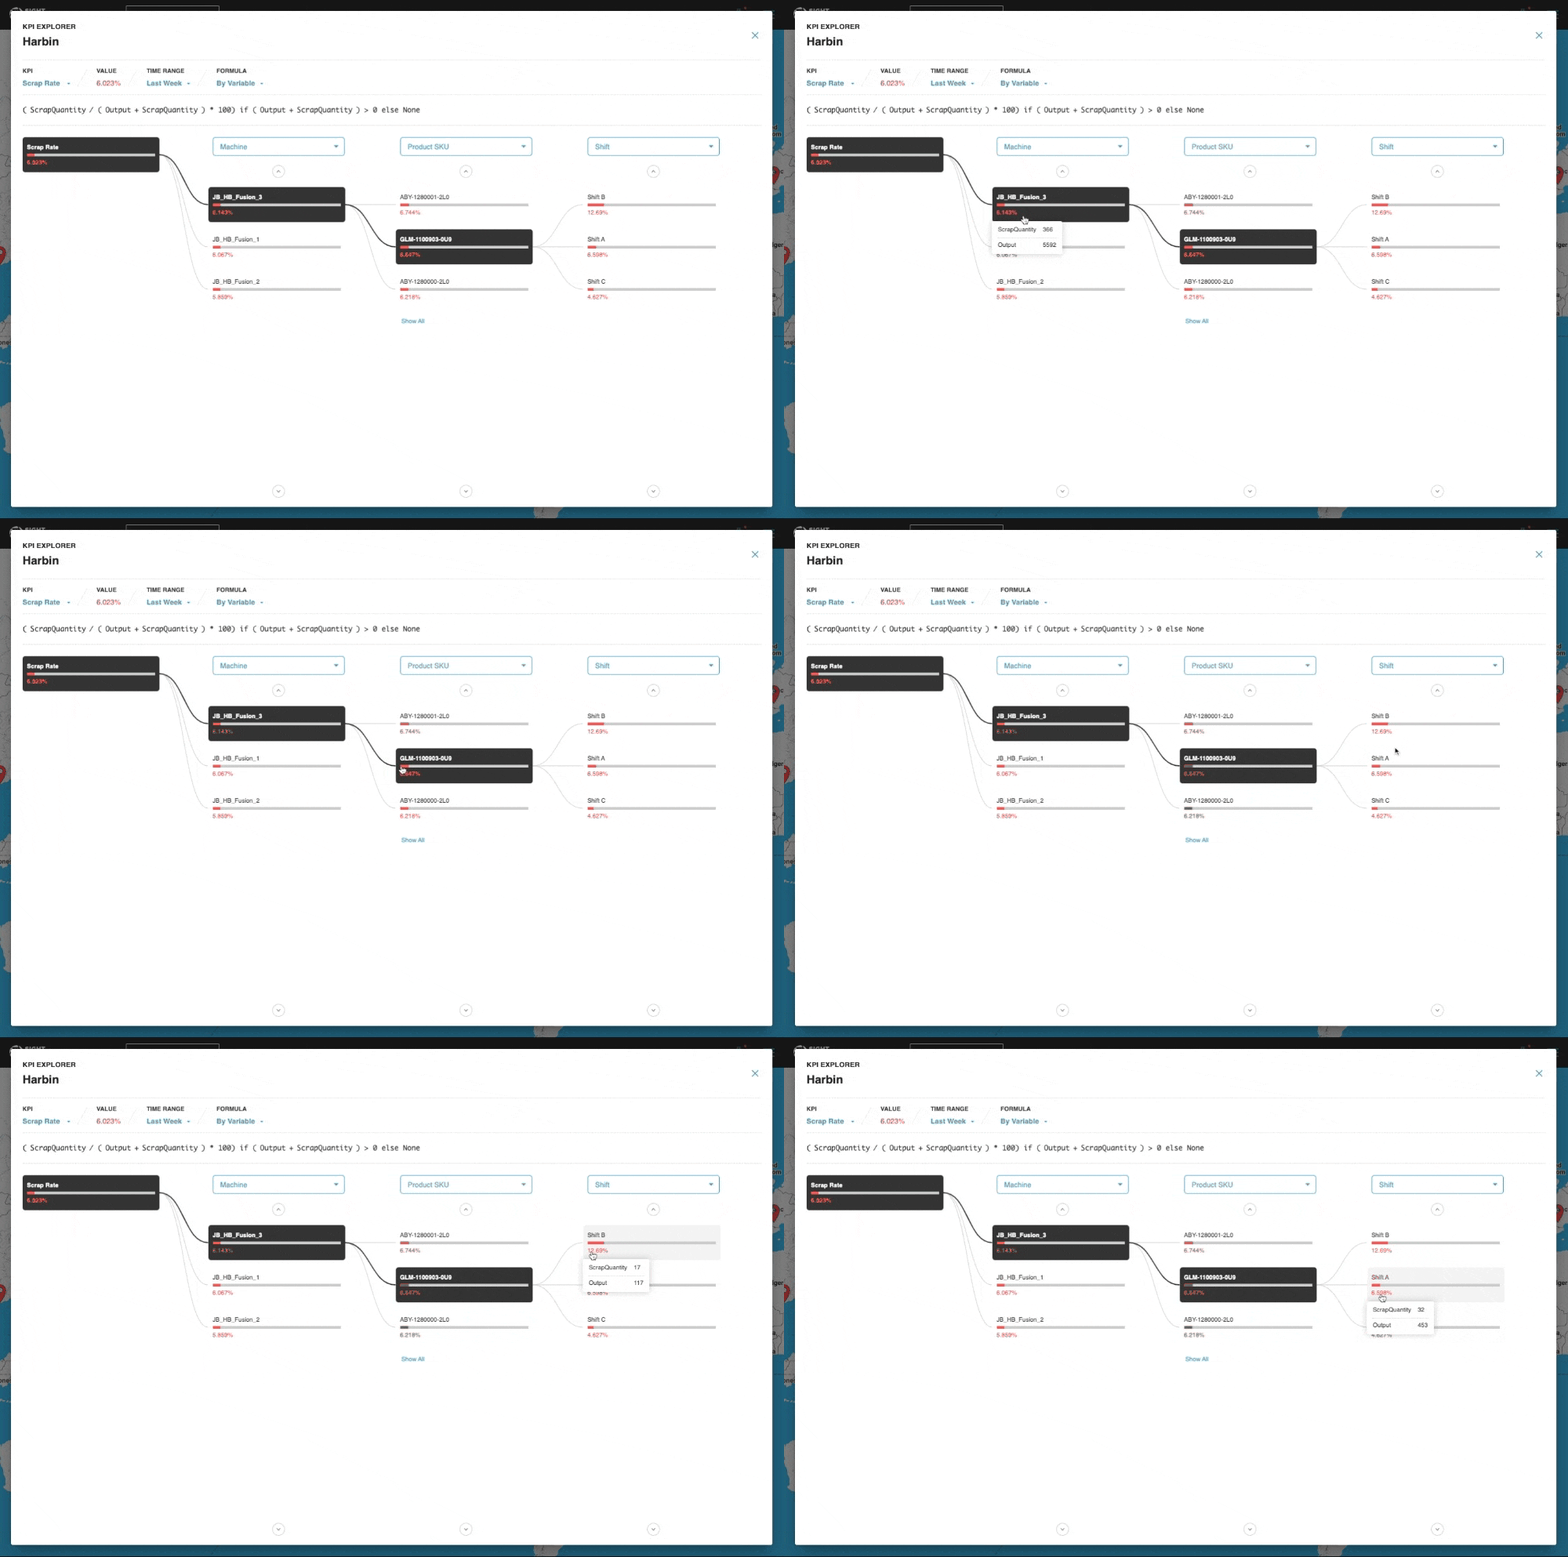
At each drill-down, Sight Machine automatically surfaces the 3 lowest performing KPI values, enabling you to quickly identify the largest issues. To view all the components and not just the Top 3 values, click Show All.
The top-level KPI (as well as each breakdown component) is color-coded based on target thresholds that are configured for that specific KPI.
You can view the values of the KPI dependency fields (included in the configured formula) by hovering over the progress bar that displays the value.
Contact your Customer Success representative to configure or modify KPIs, including the formula, target thresholds, and optimal directionality settings.
Each successive drill-down in the KPI Explorer applies the Breakdown variable as a filter on top of the previously selected Breakdown variable.
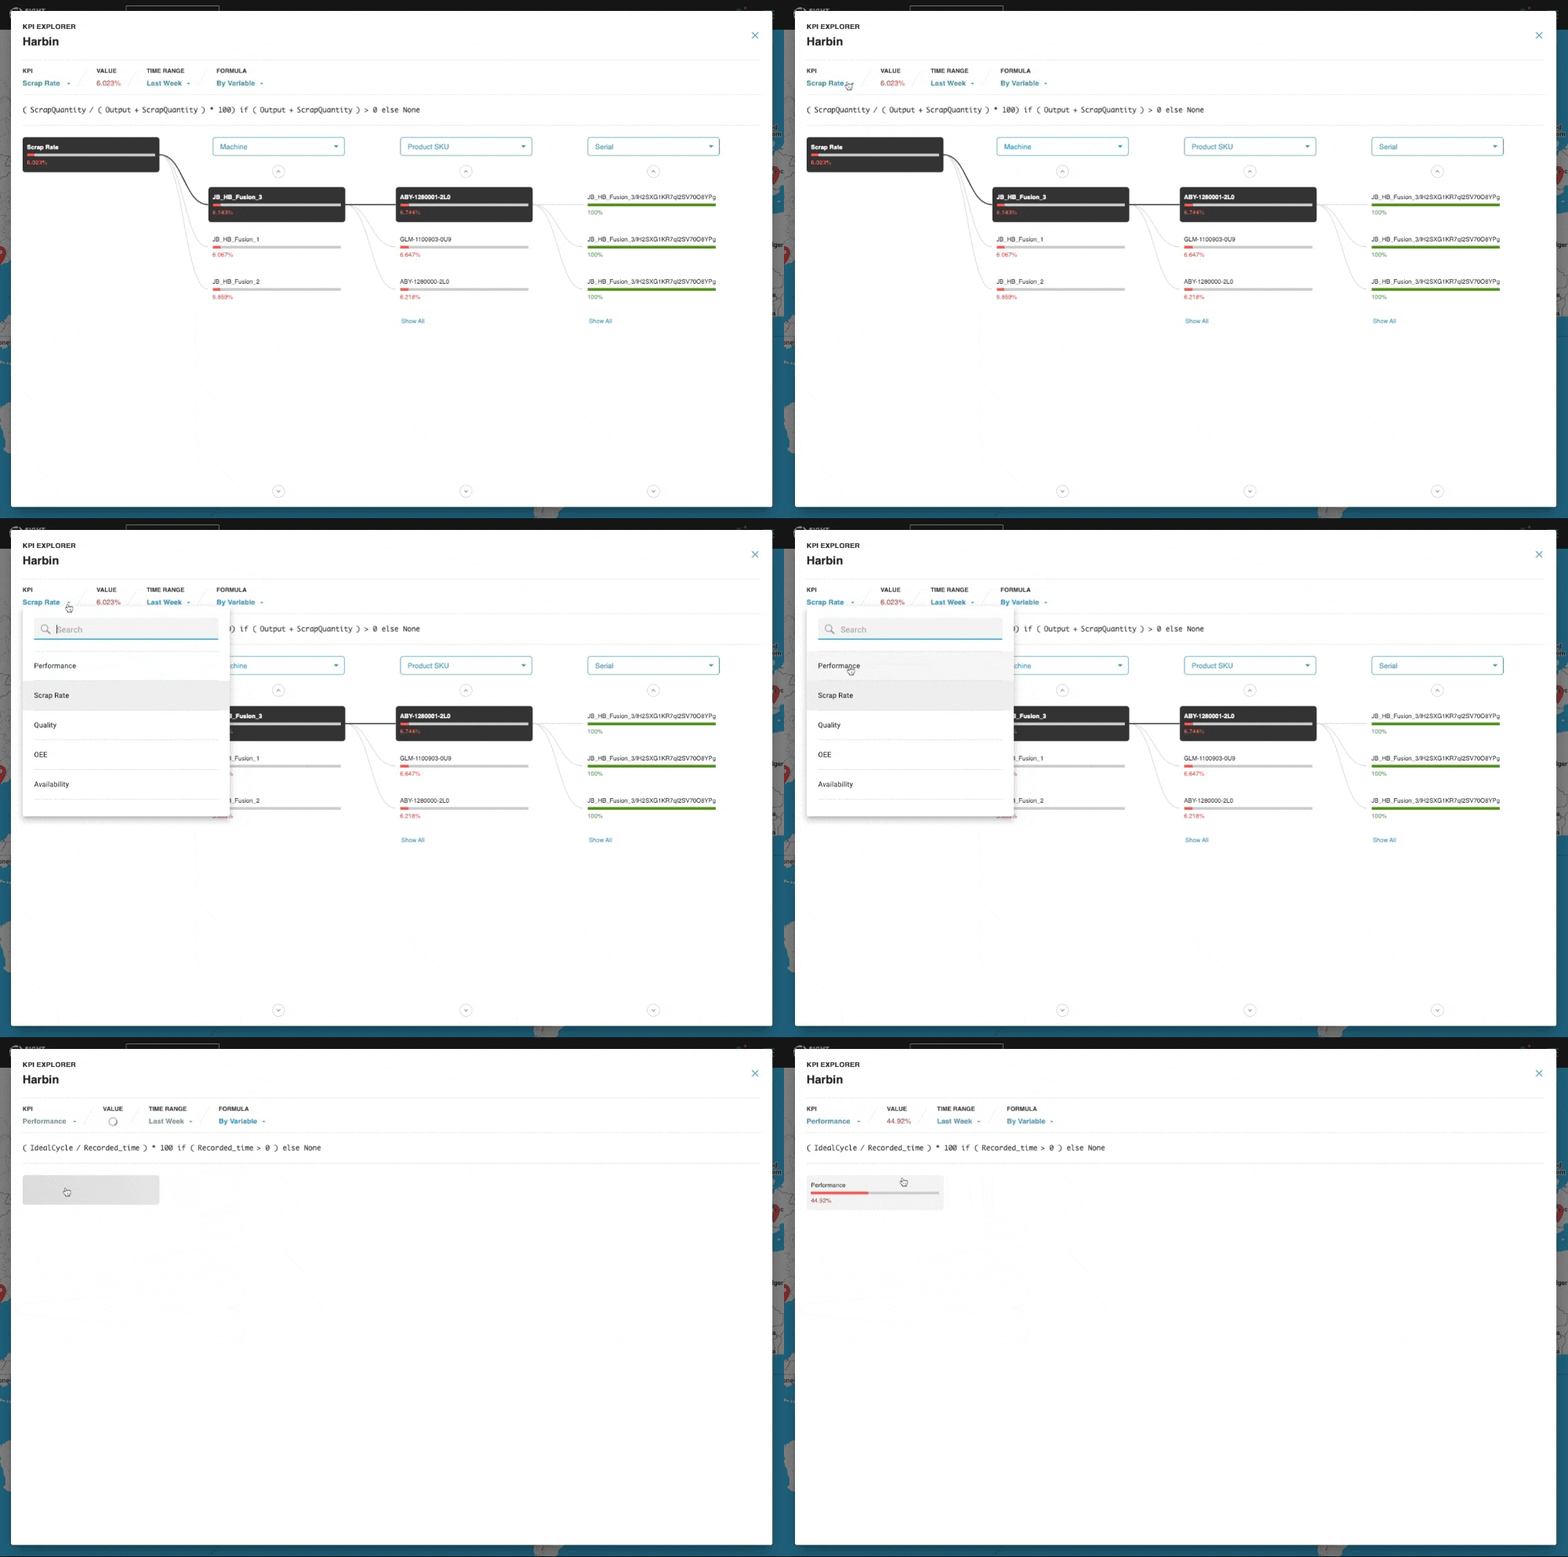
Click the KPI drop-down menu to explore a different KPI of interest.
You can also click Time Range to modify the time range over which the KPI is computed.
Data Tables: Save to Dashboard
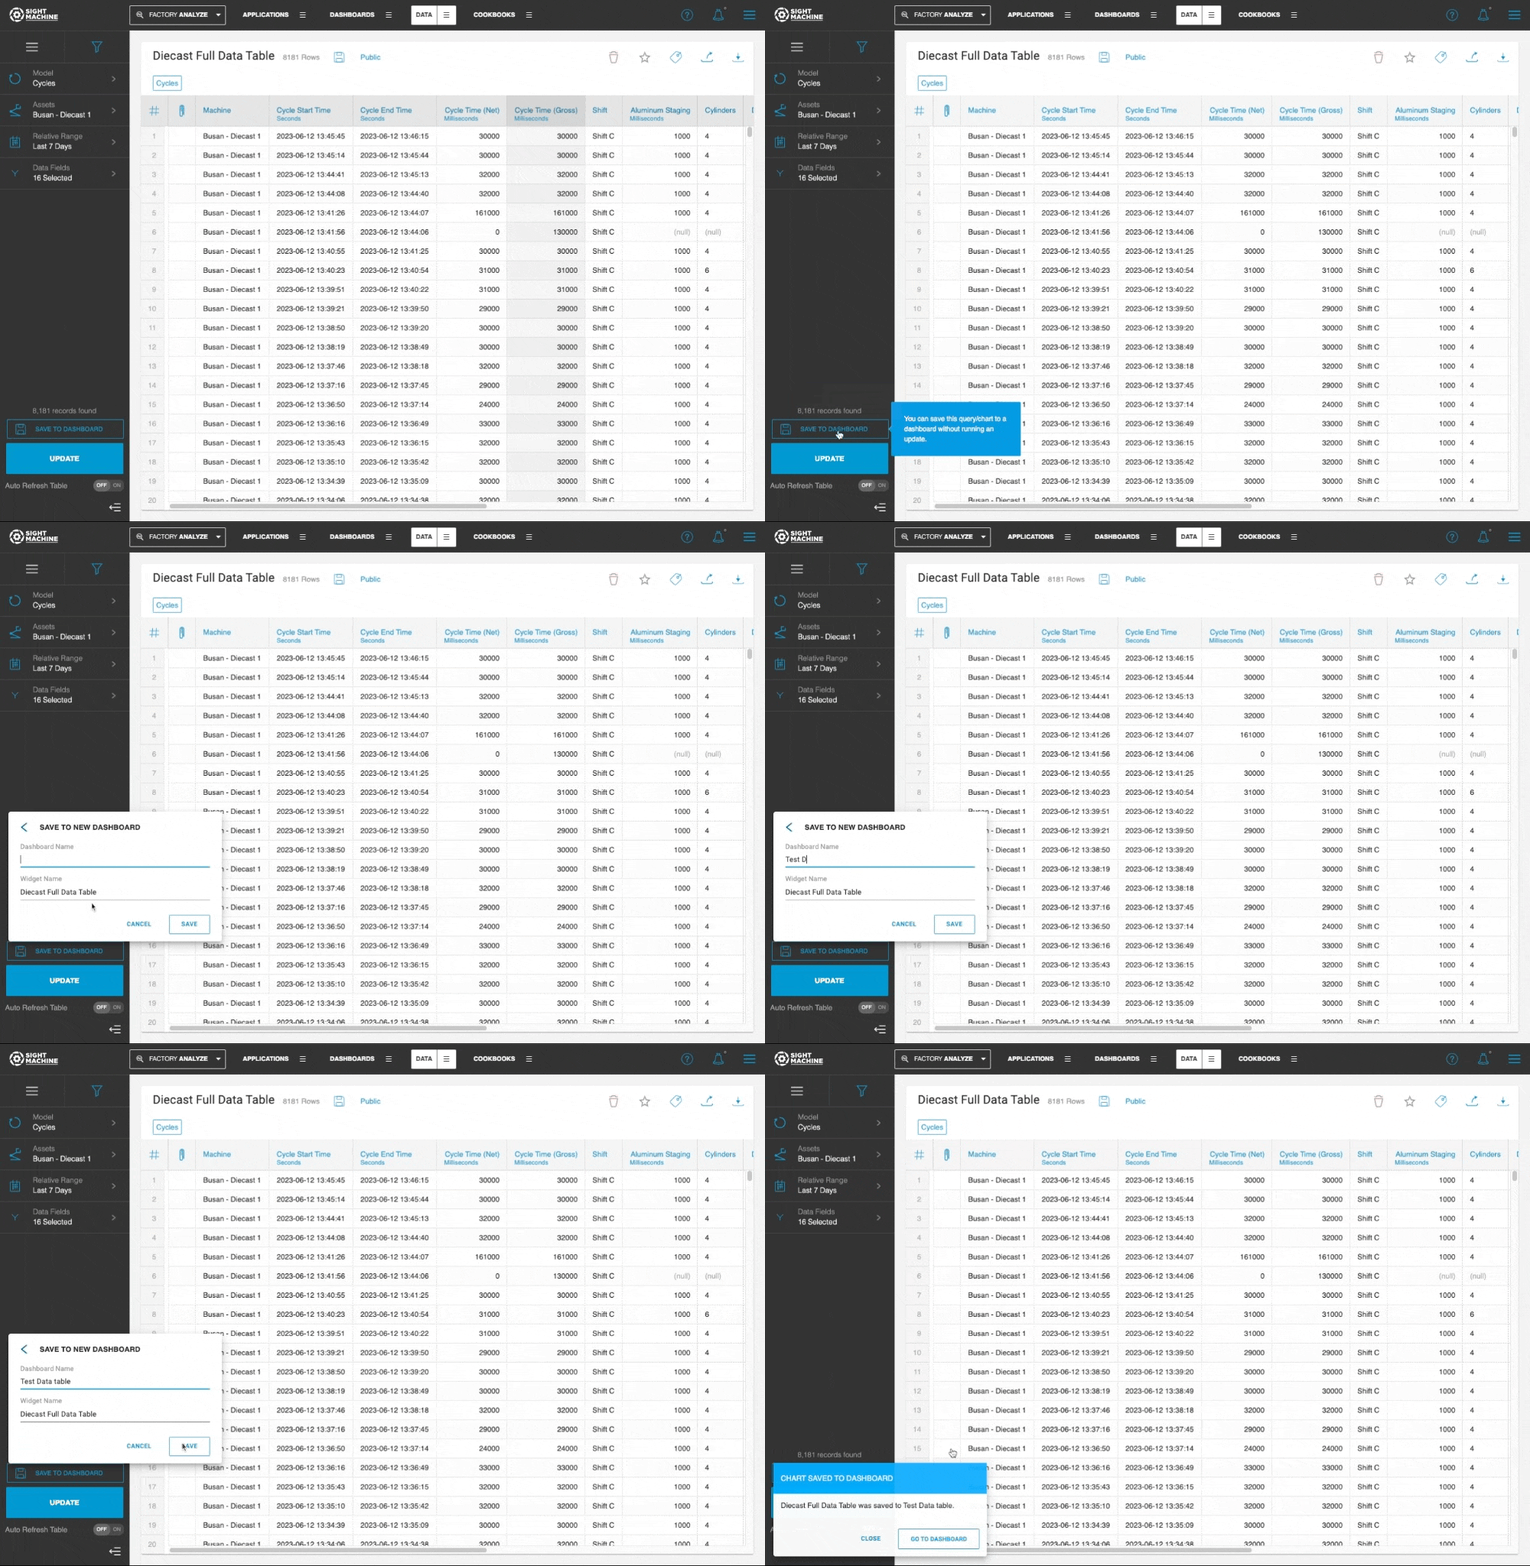
You can now display data tables in Sight Machine on a Dashboard using the new Save to Dashboard button. You can save data tables to a new or existing dashboard.
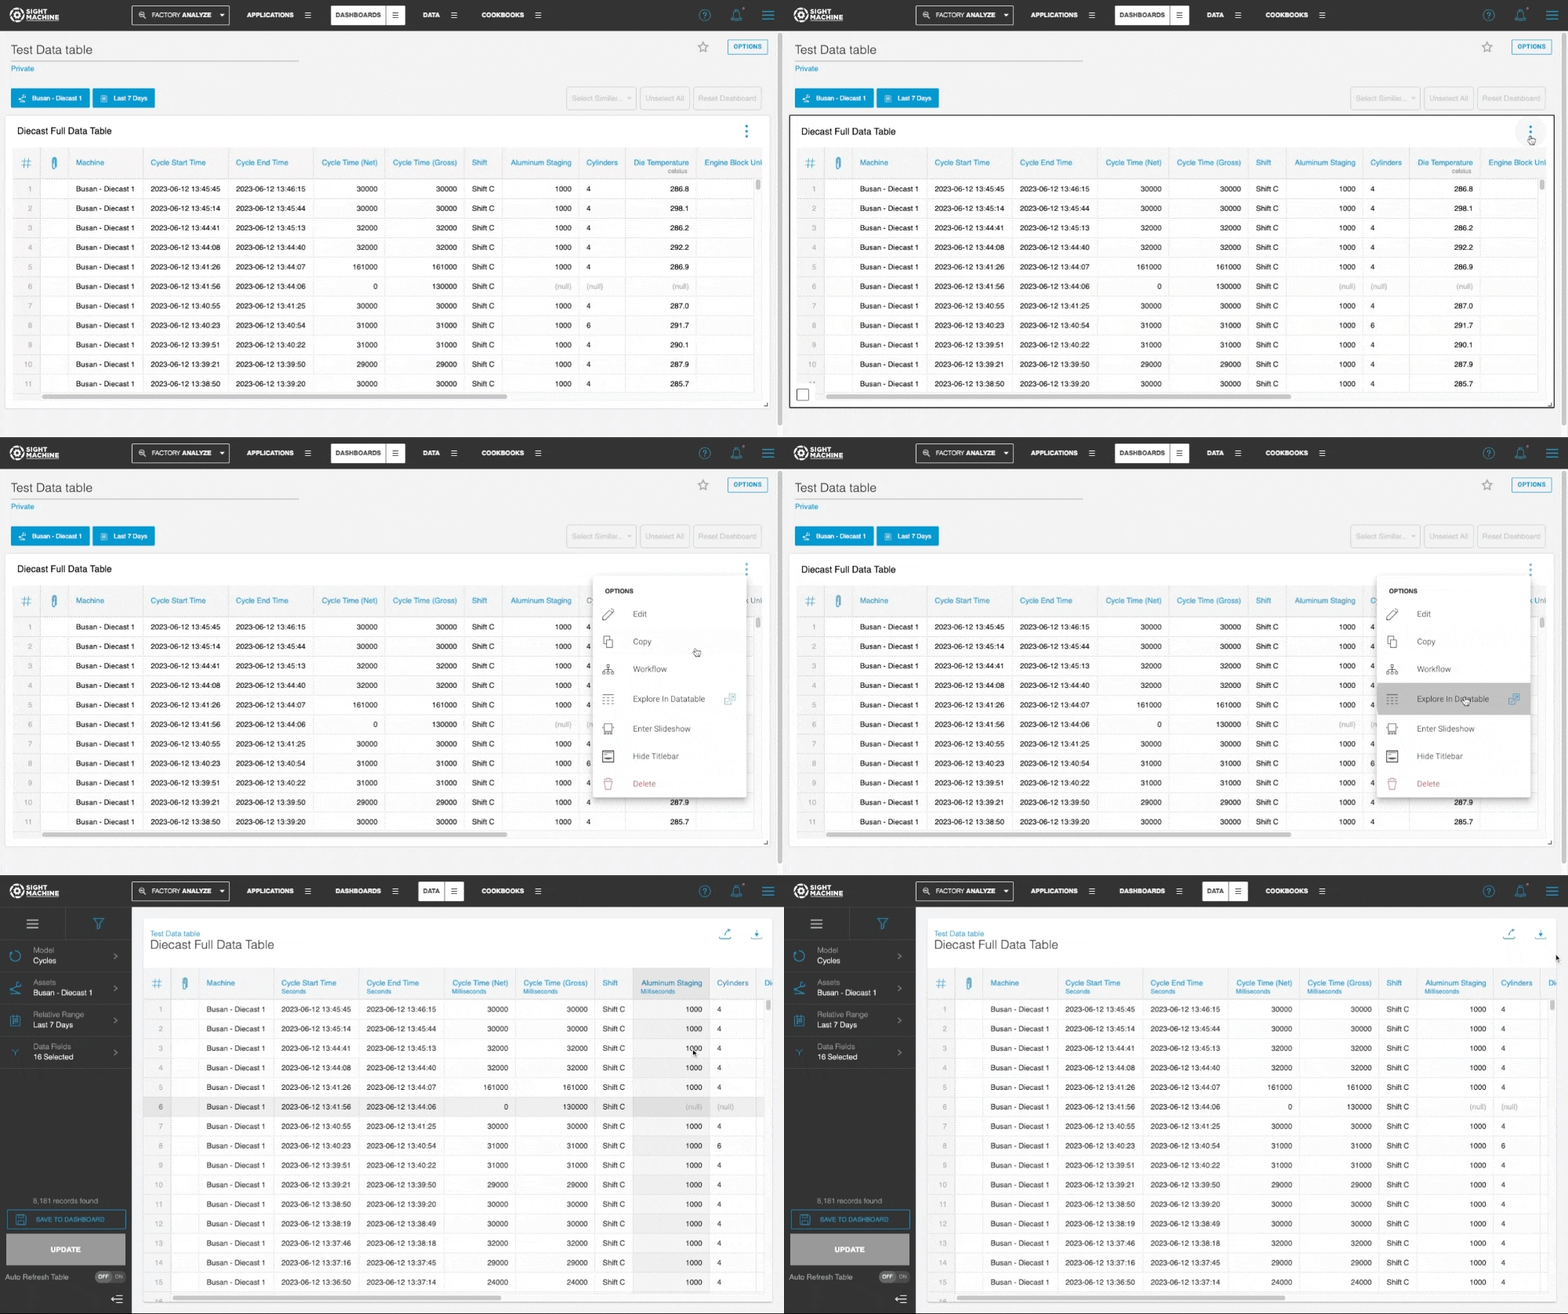
After you create or update the dashboard, click the overflow menu in the Data Table widget, and then click Explore in Datatable to navigate back to the data table.
Updates/Fixes
- An issue in which the updated schema was not displayed when moving between operators if the input/output schema was open has been resolved.
- Variance Analysis and Timeline Analysis now support the Production Calendar when you select the Lines model.
- An issue in which the incident summary was not displaying the details for KPI and Data Latency alerts has been resolved.