Raw Data Monitoring
- Print
- DarkLight
Raw Data Monitoring
- Print
- DarkLight
Article summary
Did you find this summary helpful?
Thank you for your feedback
Use Cases
Raw Data Monitoring is designed to visualize selected raw fields as they stream into the Sight Machine platform in real time. Since raw data arrives in the platform as individual records, Raw Data Monitoring uses a form of interpolation to visualize the data as a continuous stream.
How to Use Raw Data Monitoring
You can view raw data in real time as it streams into the AI Data Pipeline.
To use Raw Data Monitoring:
- On the Analysis tab, under Data Exploration, click Raw Data Monitoring.
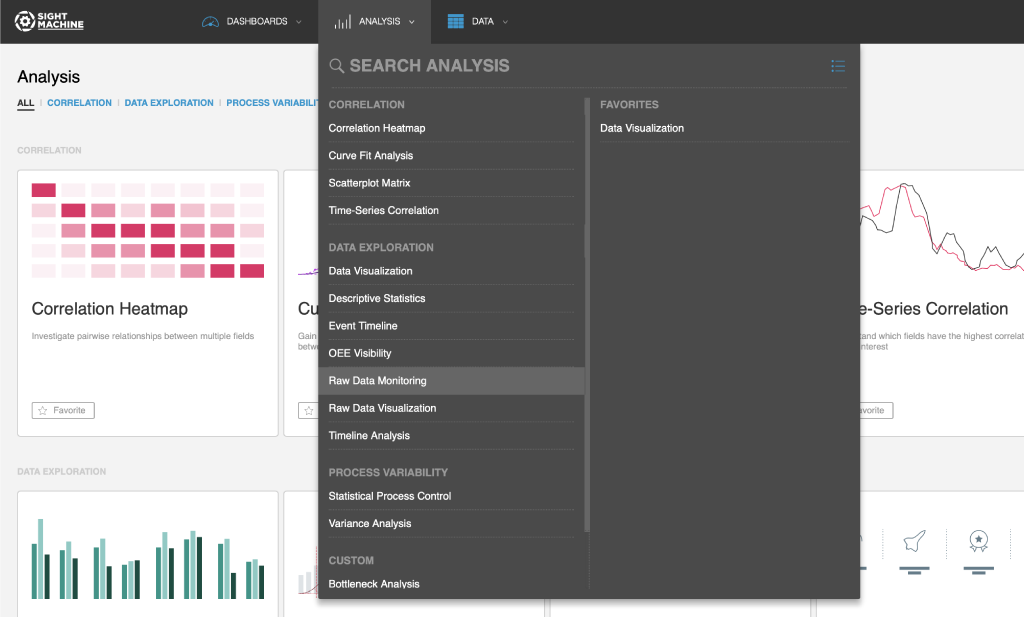
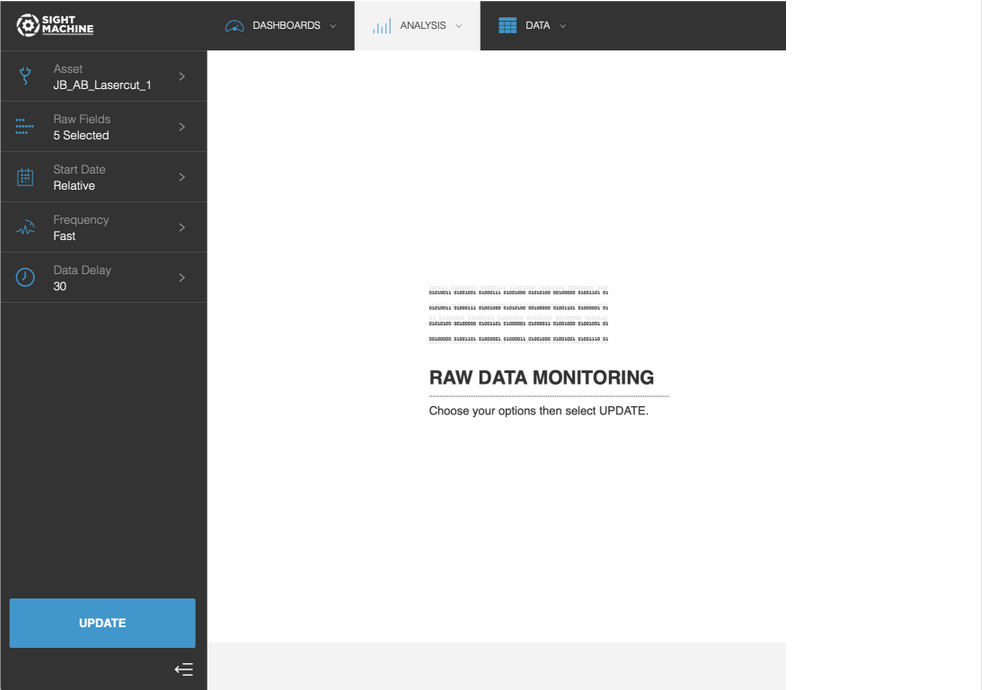
- On the main Raw Data Monitoring screen, select your options on the left. For more details about each option, see Raw Data Monitoring Options.
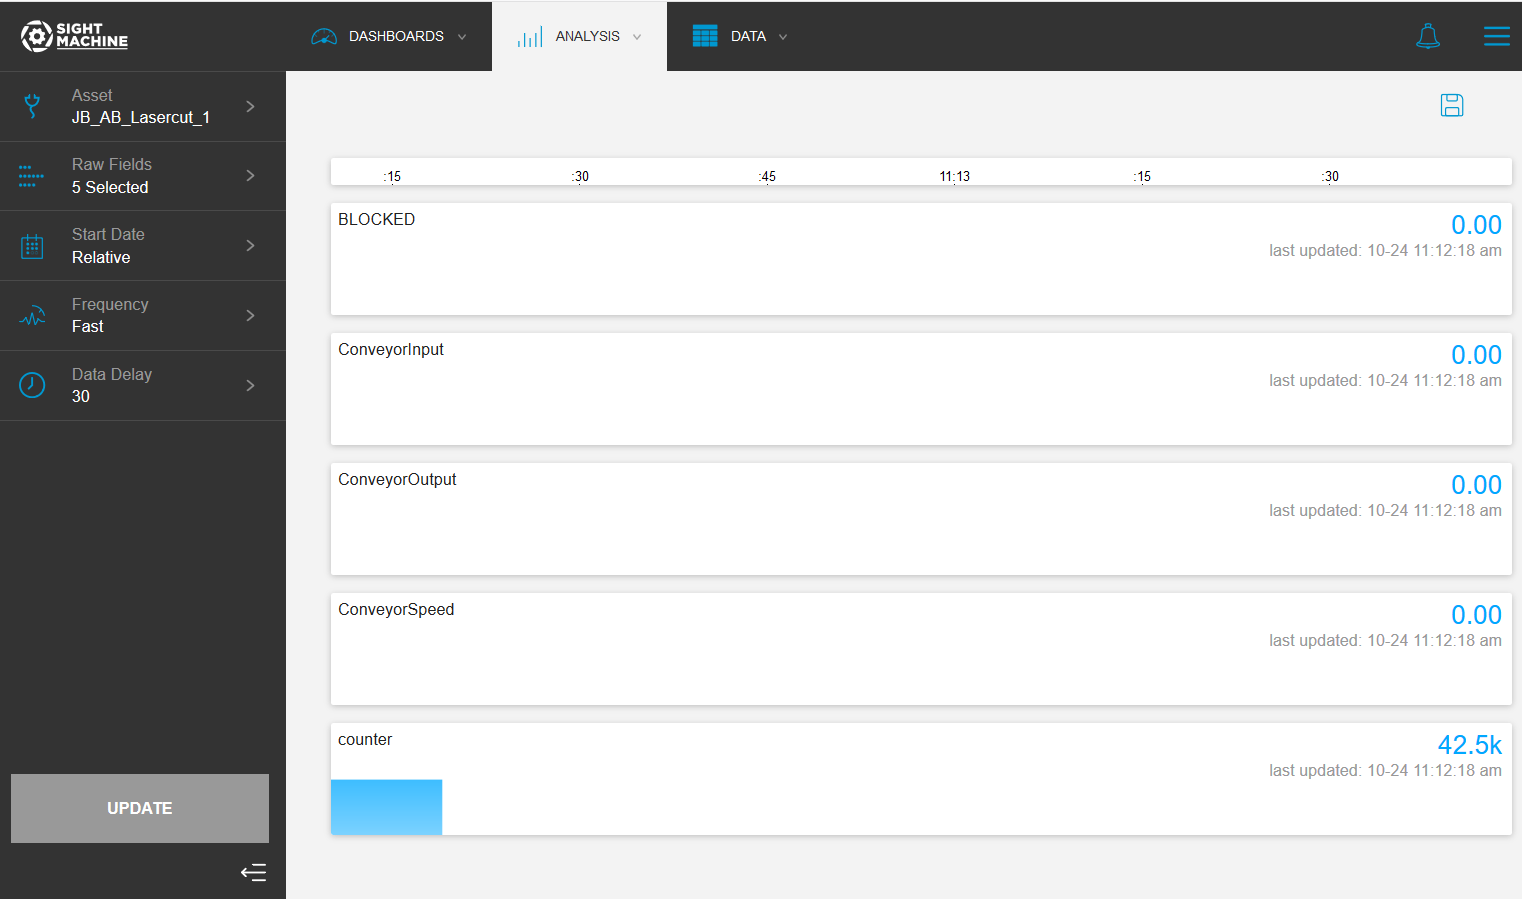
- Click Update to monitor streaming raw data.
- View the results.
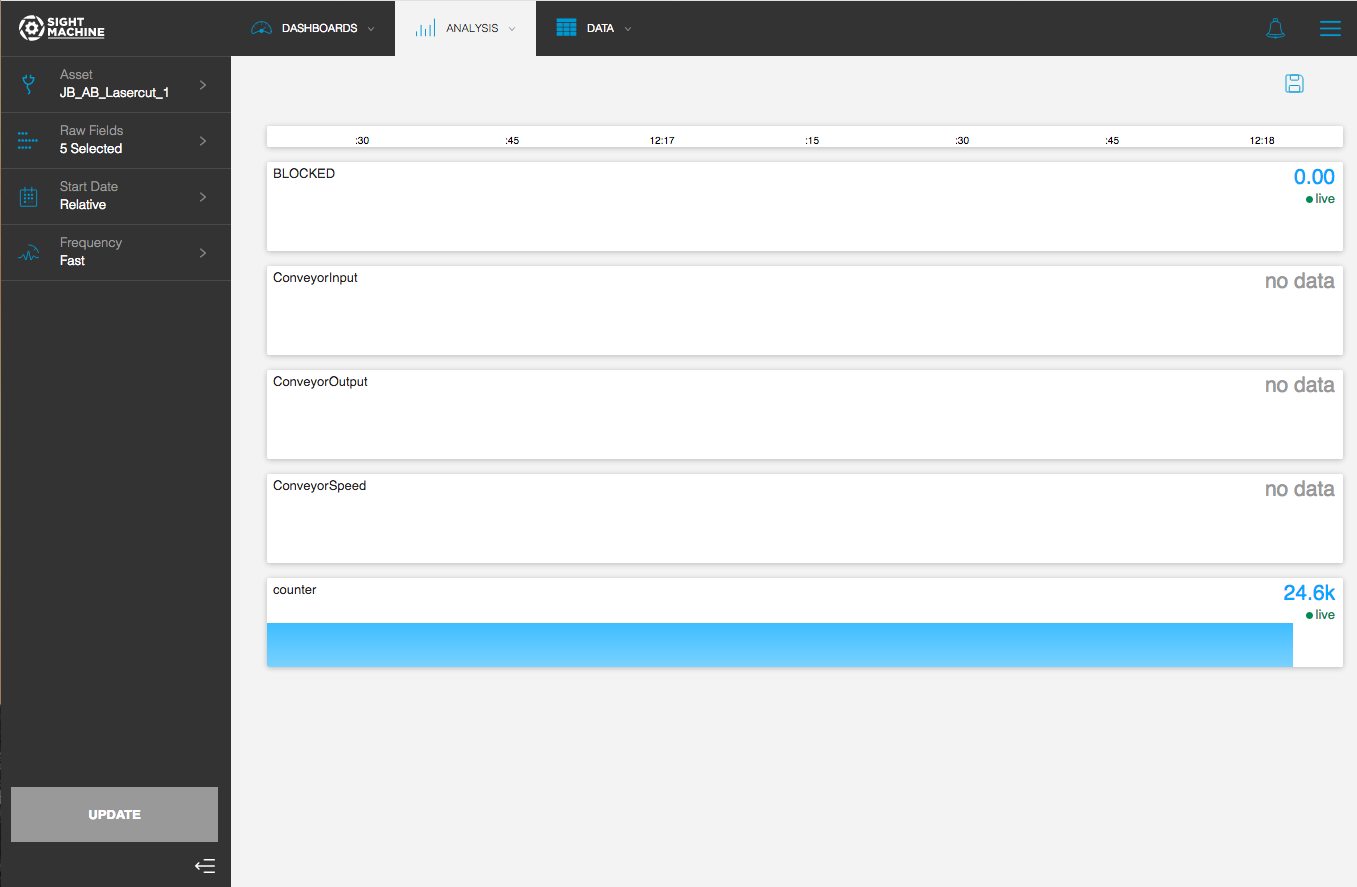
Raw Data Monitoring Options
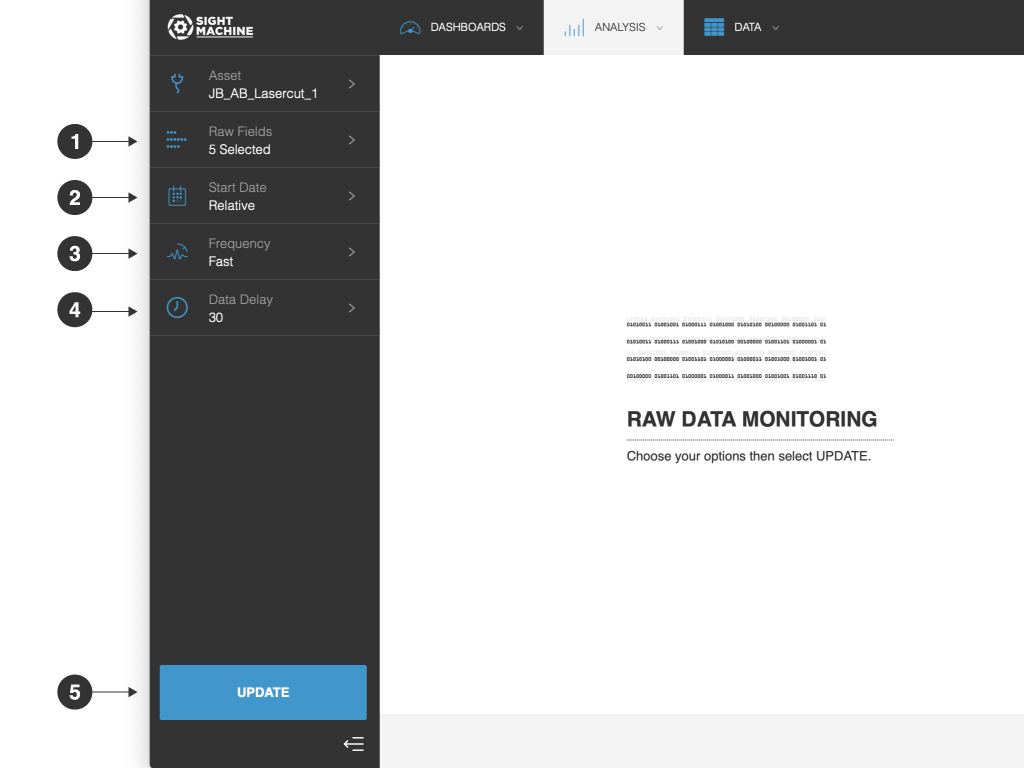
The Raw Data Monitoring options include:
- Asset: You can select an asset from your raw data.
- Raw Fields: You can select up to five of the associated raw fields being captured for the selected asset.
- Start Date: You can select a rolling date shortcut or a duration of time. The default is Relative. Relative dates update automatically. You can also select an Absolute Range, which is a date and/or time in the past. You then stream data starting from that point. Absolute Ranges do not automatically update.
- Frequency: You can select the streaming frequency of the visualization. This setting lets you control the pace at which data is visualized, irrespective of the pace at which it is collected. For example, Fast means you see less data on-screen, but it updates more frequently. Slow means you see more data on-screen, but it updates less frequently.
- Update: Click this button to start or restart monitoring the raw data.
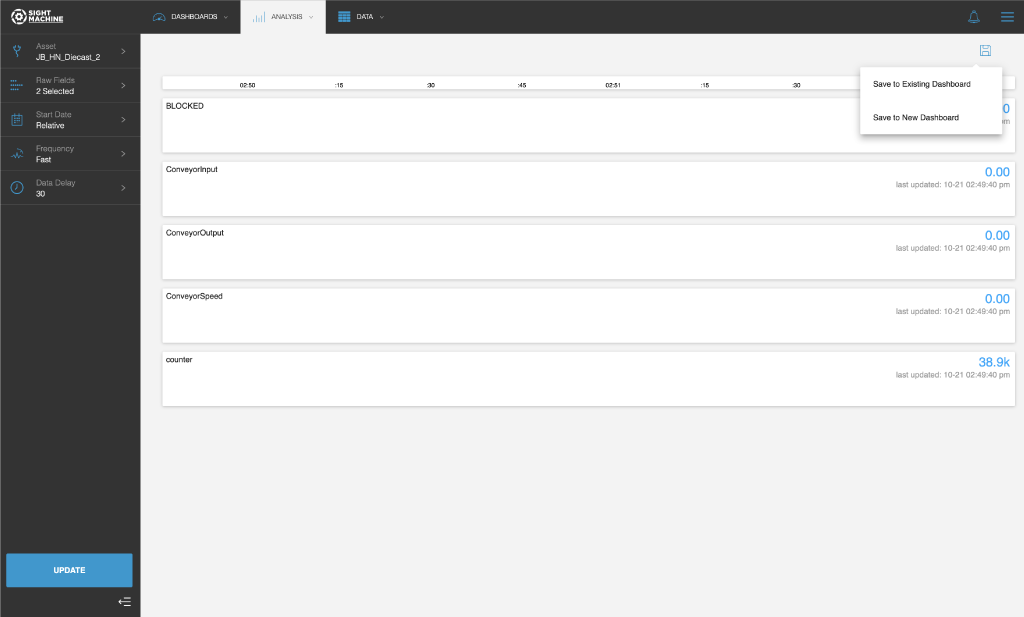
Saving the Raw Data Monitoring
After you generate your raw data, you can save your settings to a dashboard.
To save the Raw Data Monitoring:
- On the Raw Data Monitoring screen, in the upper-right, click the Save button.
- Select one of the following options:
- Save to Existing Dashboard: Search for an existing dashboard.
- Save to New Dashboard: Provide names for the new dashboard and the new widget on the dashboard.