Use Cases
The Statistical Process Control (SPC) tool allows you to monitor process stability to improve product quality and optimize manufacturing processes. The SPC tool plays a critical role in production because stability monitoring allows you to:
- Increase output while minimizing scrap, waste, rework, and defects.
- Prevent process errors that lead to defects, letting you consistently deliver the highest quality product.
- Deliver actionable information to personnel, minimizing the response time to correct process variation.
- Support compliance and regulatory efforts through cost-effective recording of part/batch process variability.
Specifications
The SPC tool provides:
- Contextualized models that allow for segmentation of machine/line data based on the production of different parts/SKUs.
- User-defined specification limits and calculated control limits that identify when processes are not acting predictably.
- Nelson rule application that detects non-random conditions in the data stream.
- Descriptive statistics such as min, mean, max, and CPK/CP values.
It is important to remember that the parameter data being monitored in the SPC tool is built on the data modeled by Sight Machine’s AI Data Platform. The AI Data Pipeline uses machine learning and AI to summarize parameter readings for each cycle, eliminating noise from higher granularity readings that may be too detailed for an exploratory analysis and ignoring variability that happens outside the cycle, such as during planned downtime, that could interfere with the analysis.
How to Use Statistical Process Control
The Statistical Process Control tool lets you monitor process stability.
To use Statistical Process Control:
- On the Analysis tab, under Process Variability, click Statistical Process Control.
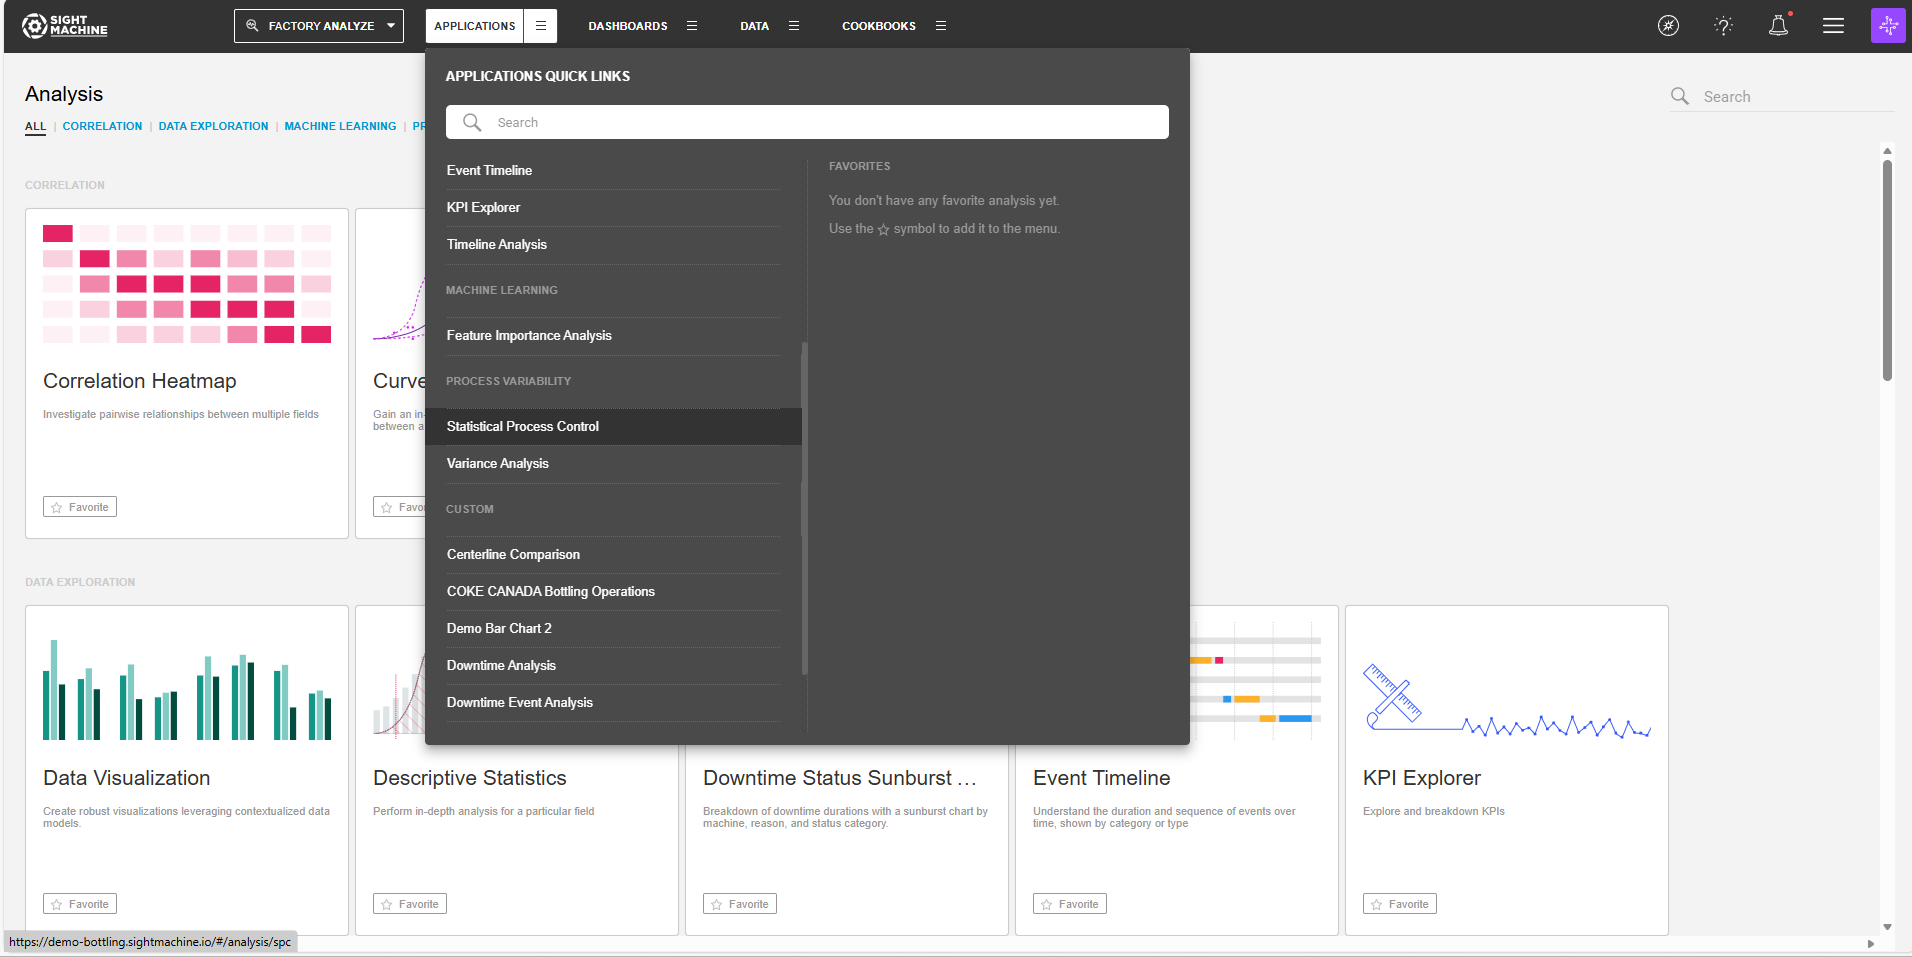
- On the main Statistical Process Control screen, select your options on the left. For more details about each option, see Statistical Process Control Options.
- Click Update.
Statistical Process Control Options
The Statistical Process Control options include:
- Model: You can analyze only cycles at this time. You cannot change this option.
- Assets: You can select an asset, or multiple assets of the same type, to monitor.
- Relative Range: You can define a date range of data points to analyze for the assets you have selected. For example, select the last 7 days. This option establishes the boundaries for the near real-time data that will be part of your analysis. Select from relative or absolute timeframes.
- Data Field: You can select a parameter to monitor.
- Spec Limits: You can set specification limits for your manufacturing process.
- Chart Type: You can select the chart type most relevant to your process. You have a choice between I-MR, x-bar R, and x-bar S. For the x-bar R, and x-bar S options, you can also set a Subgroup Size, although it defaults to Auto.
- Update: Click this button to generate your chart.
Adding Filters to the Statistical Process Control Data
The Statistical Process Control screen sidebar contains a Filter tab.
To apply filters to the Statistical Process Control data:
- On the Statistical Process Control screen sidebar, click the Filter tab.
- Click Add Filter.
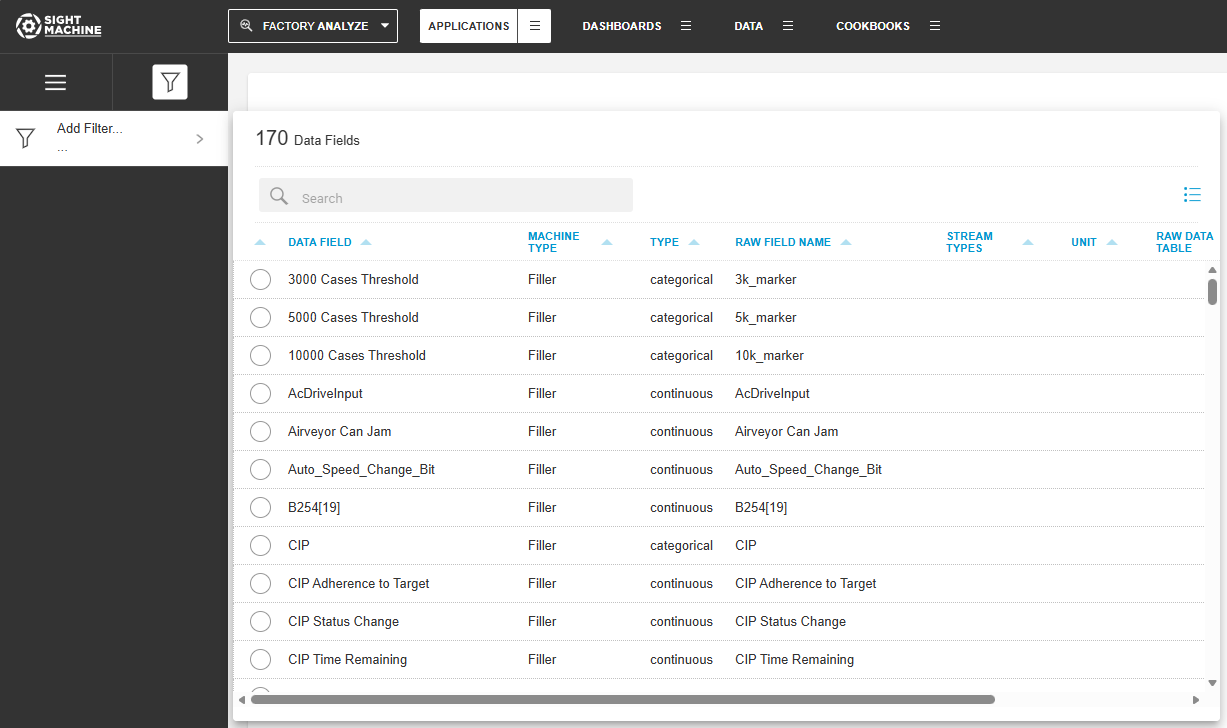
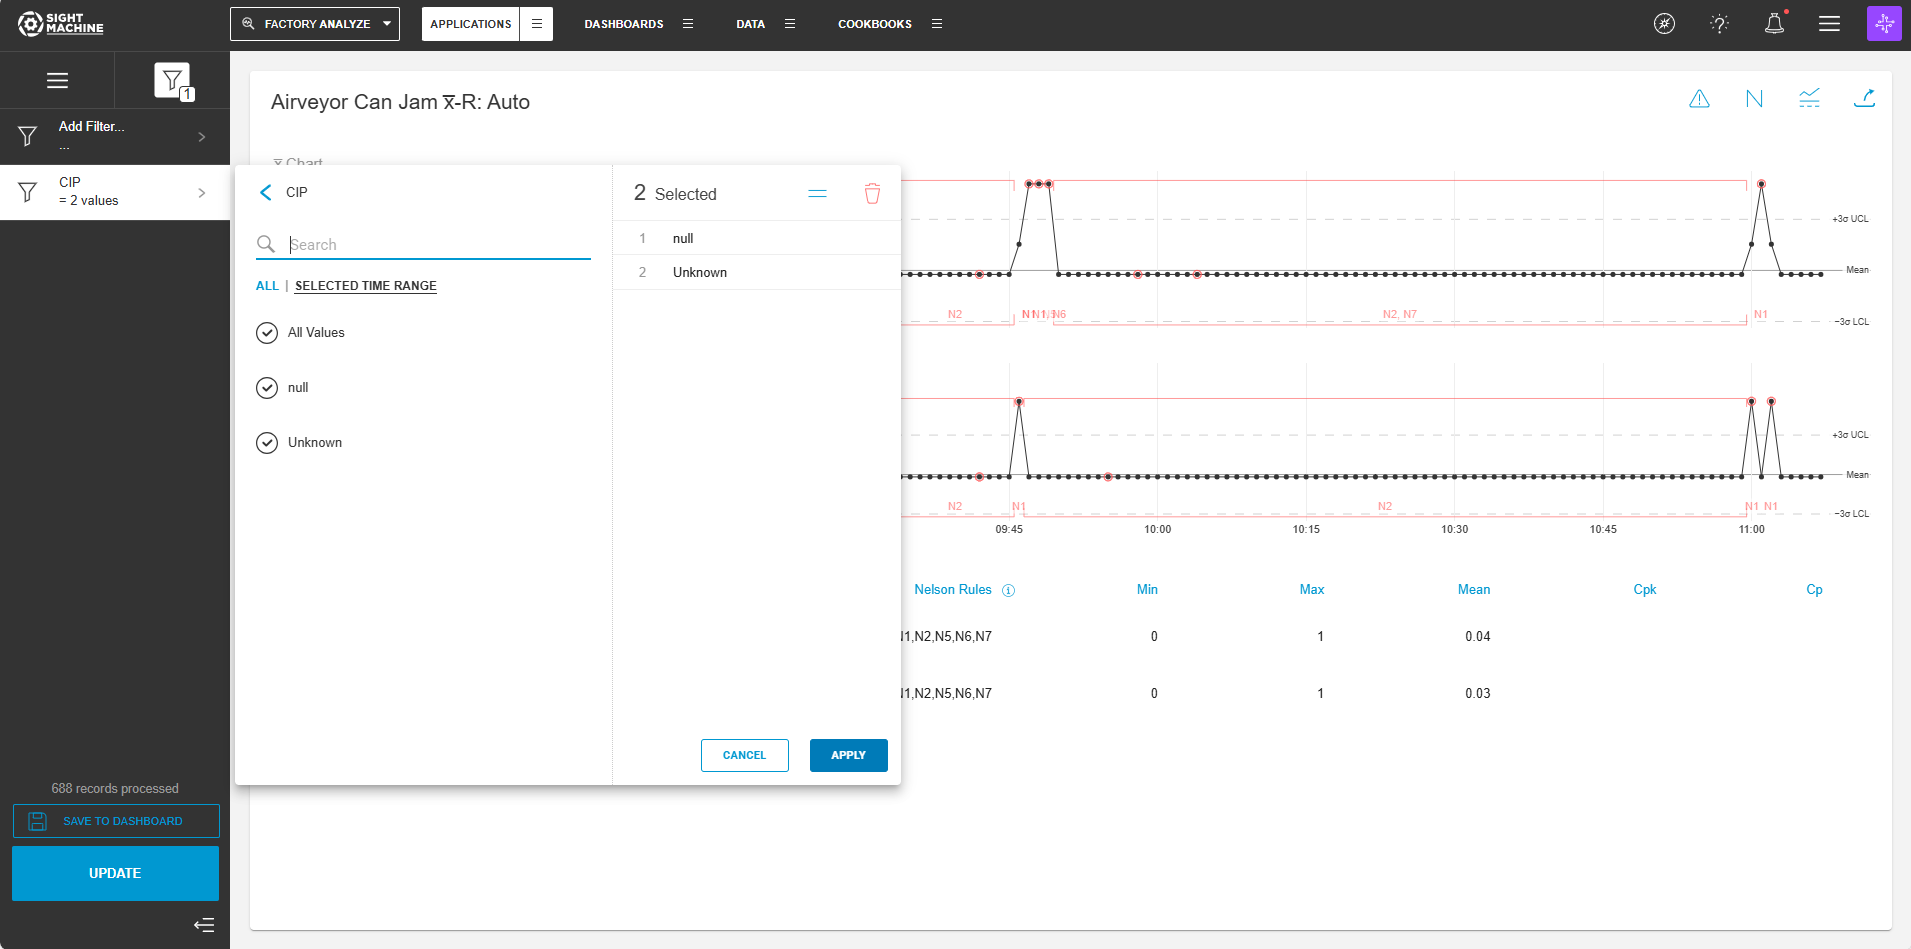
- In the Data Fields window, select a data field. For categorical fields, you can select a value or set of values (and toggle between equal to and not equal to). For continuous fields, you can apply one or more numeric conditions (for example, range, greater than, etc.).
- Click Update.
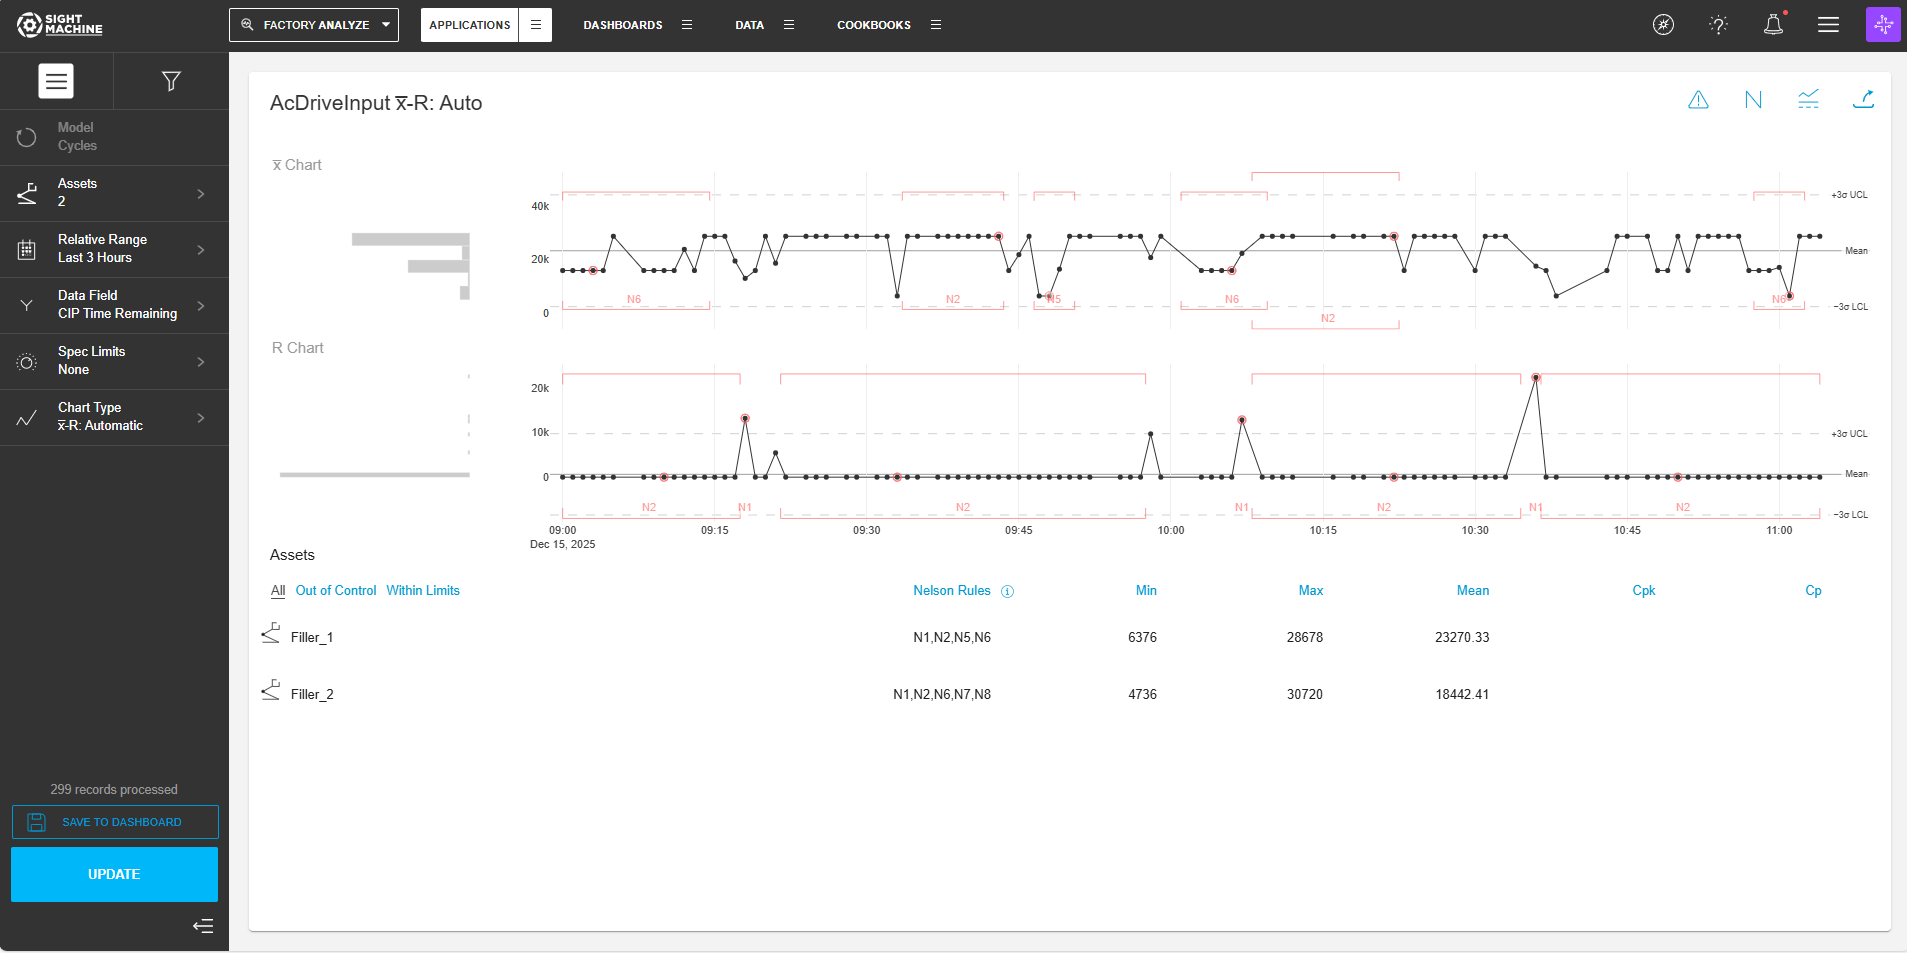
Tool Output
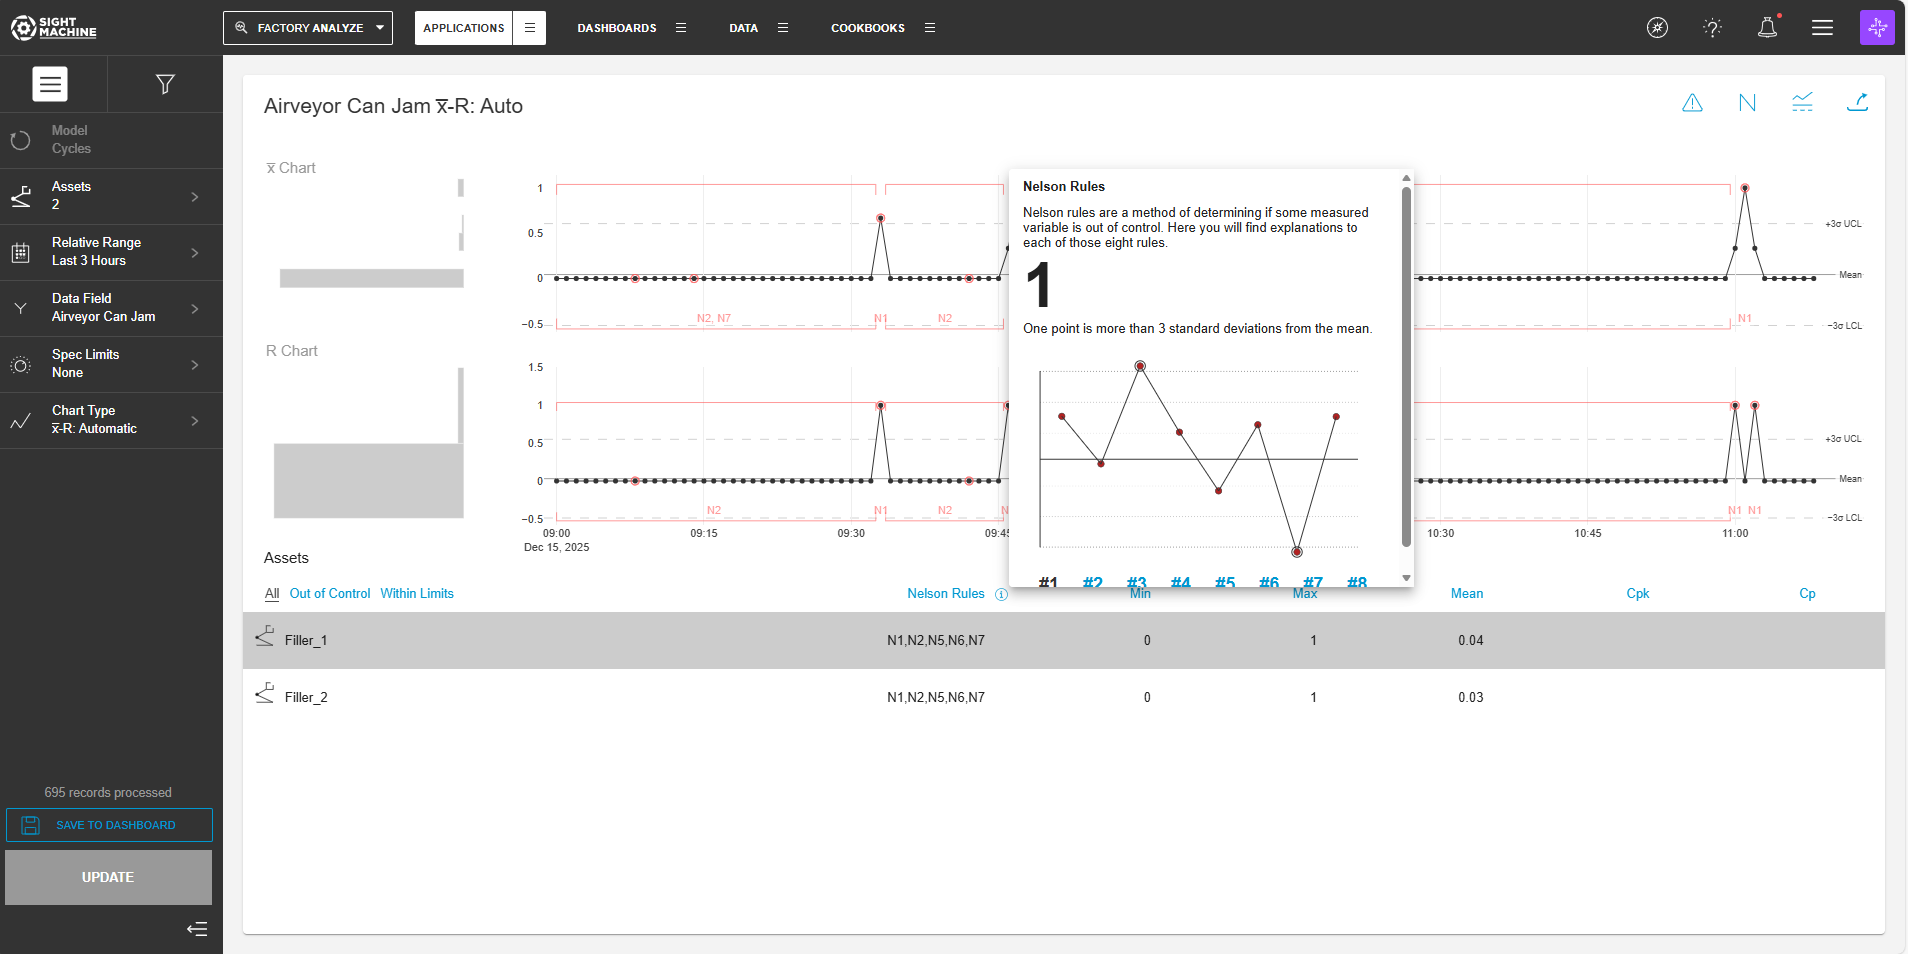
The Statistical Process Control tool produces a histogram of data points post aggregation displayed on the left. In the center is a time series chart with Nelson rule violations highlighted in red. The time series chart includes dotted lines for control limits and specification limits. The visualization also includes a data table summarizing information such as CPK and CP values.
Other Options
Next to Nelson Rules, the blue information icon provides you with a definition of the Nelson rule codes. The following is an example of Nelson rules definition from the Statistical Process Control tool:
In the upper-right, there are five icons:
- The alert icon lets you create an alert.
- The N icon lets you toggle on and off specific Nelson rule violations from the chart.
- The display icon allows you to toggle between the chart and table views.
- The share icon lets you share a link to this specific analysis.
Operationalizing Statistical Process Control
Sight Machine can enable alerts to notify you when parameters go out of specification or control limits. For more information on this capability, contact your Sight Machine engagement team or partner or see: Introduction to Intelligent Alerting
You can incorporate the SPC charts into dashboards to enable machine operators or plant managers to monitor parameter stability. For more information, see Using the Dashboard Builder.