Overview
Time-Series Correlation helps you identify which continuous parameters most influence a selected target parameter. The tool calculates Pearson correlation coefficients, ranks parameter relationships, and provides time-series visuals to help you understand how relationships behave across time.
Before You Begin
Ensure you have:
- Access to the Application tab
- Permission to view relevant assets or part types
- A continuous numeric target parameter
- At least 30 observations in the selected time range
Create a Time-Series Correlation Analysis
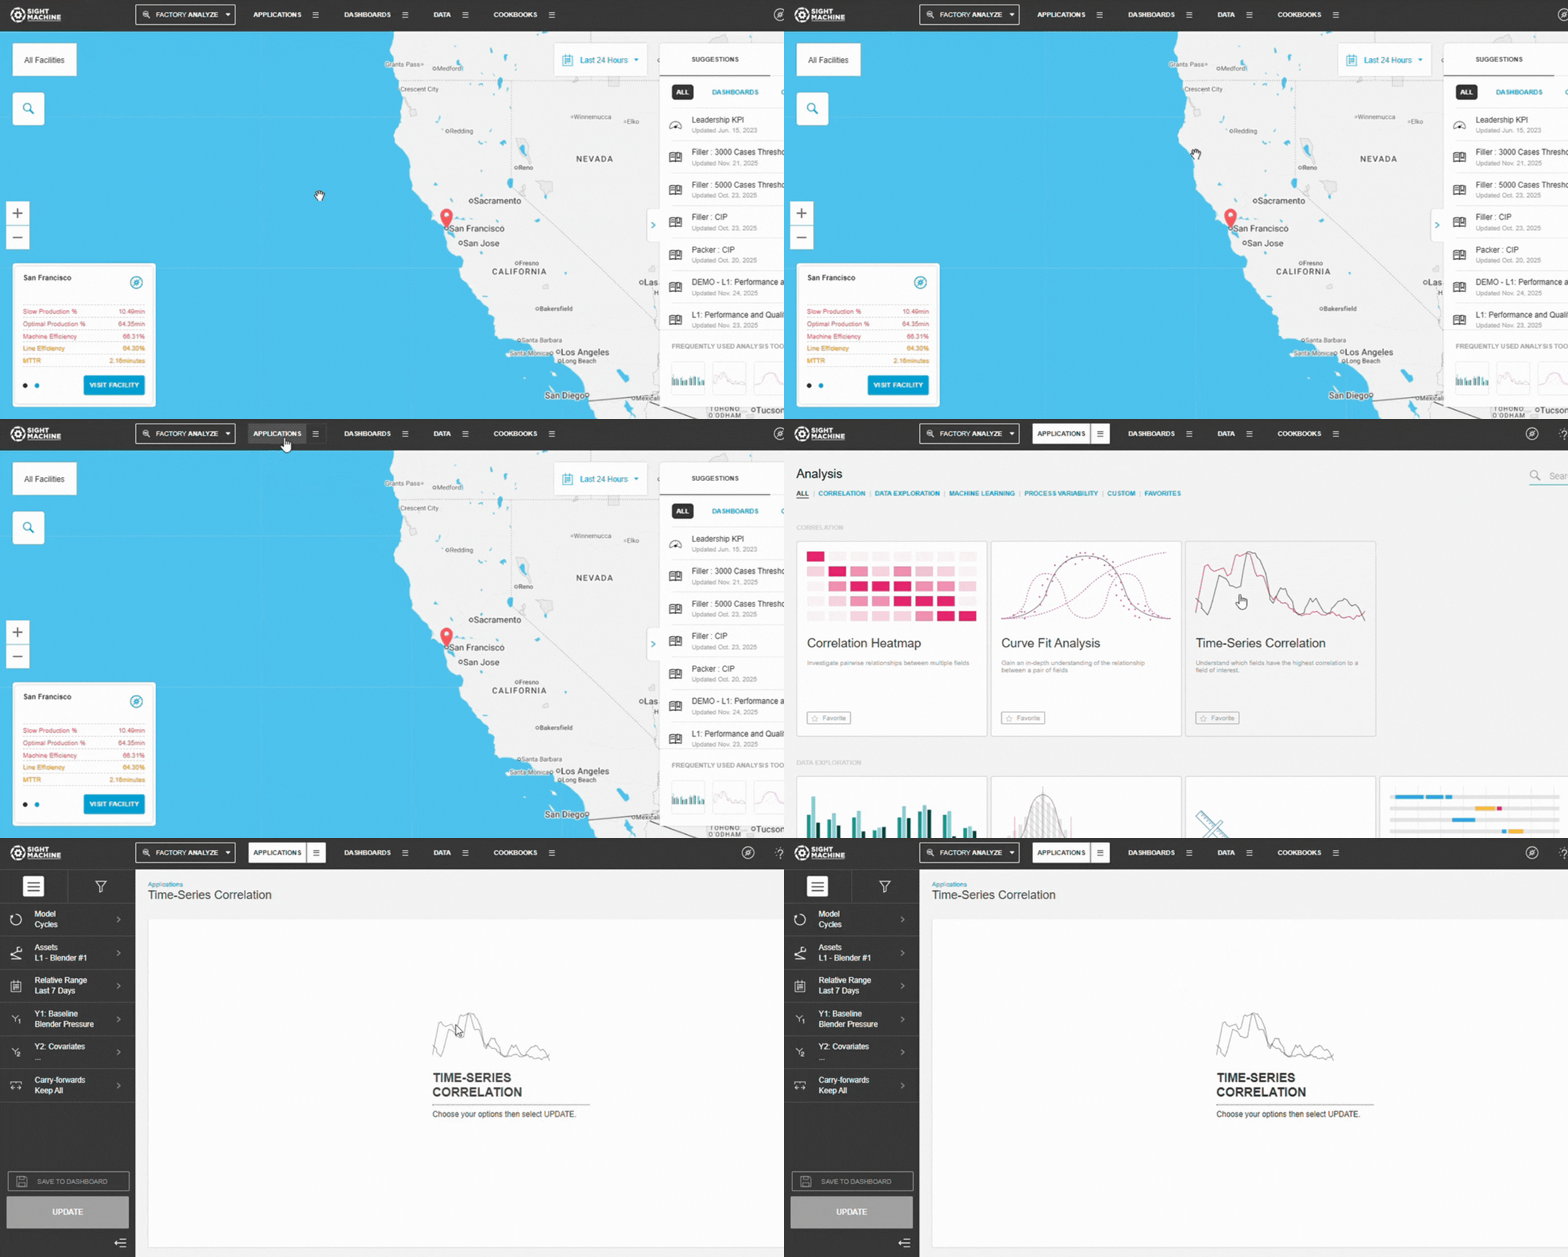
1. Open Time-Series Correlation
- Navigate to the Application tab.
- Select Time-Series Correlation.
- The configuration panel opens.
2. Select a Data Model
Choose how data should be grouped:
- Cycles – cycle-level parameters from one asset type
- Parts – part-level parameters across machines producing the same part type
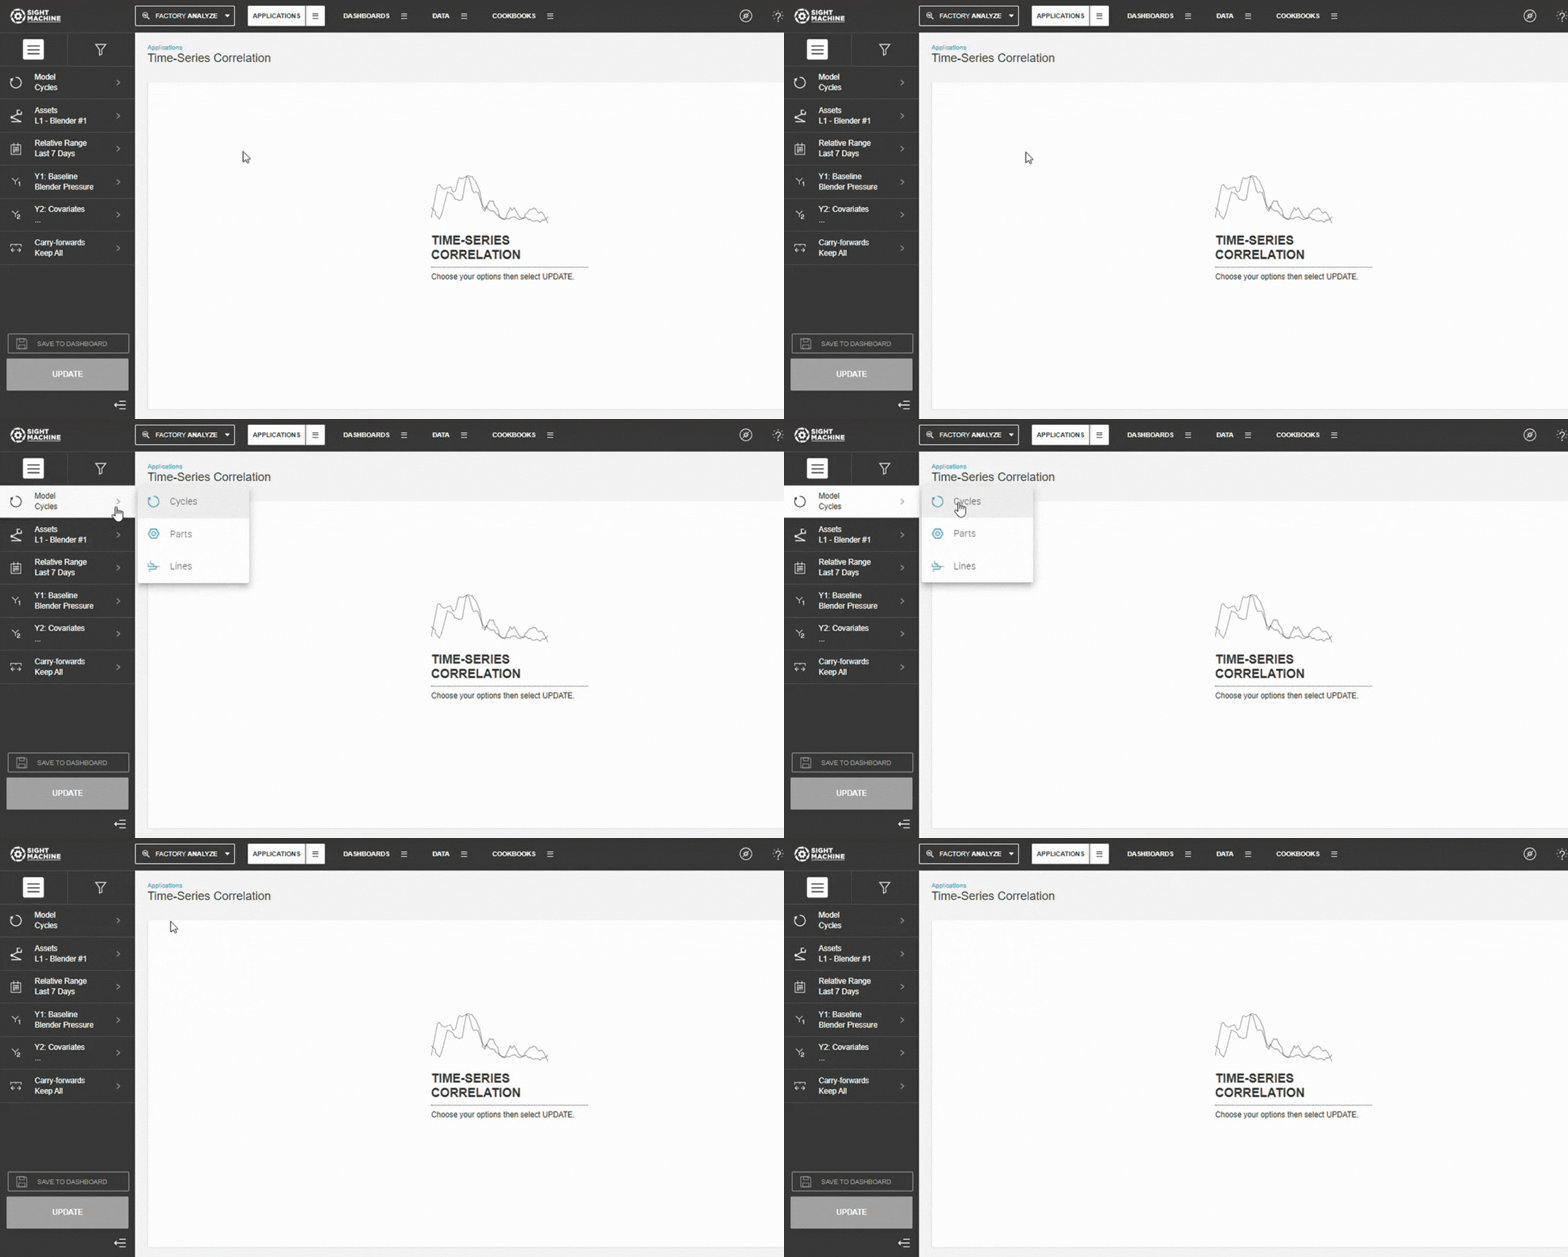
💡 Tip: Use Cycles for equipment analysis and Parts for finished product analysis.
3. Select Assets
- Choose an Asset (Cycles) or Part Type (Parts
- Select one or more assets.
- Confirm your selections in the panel.
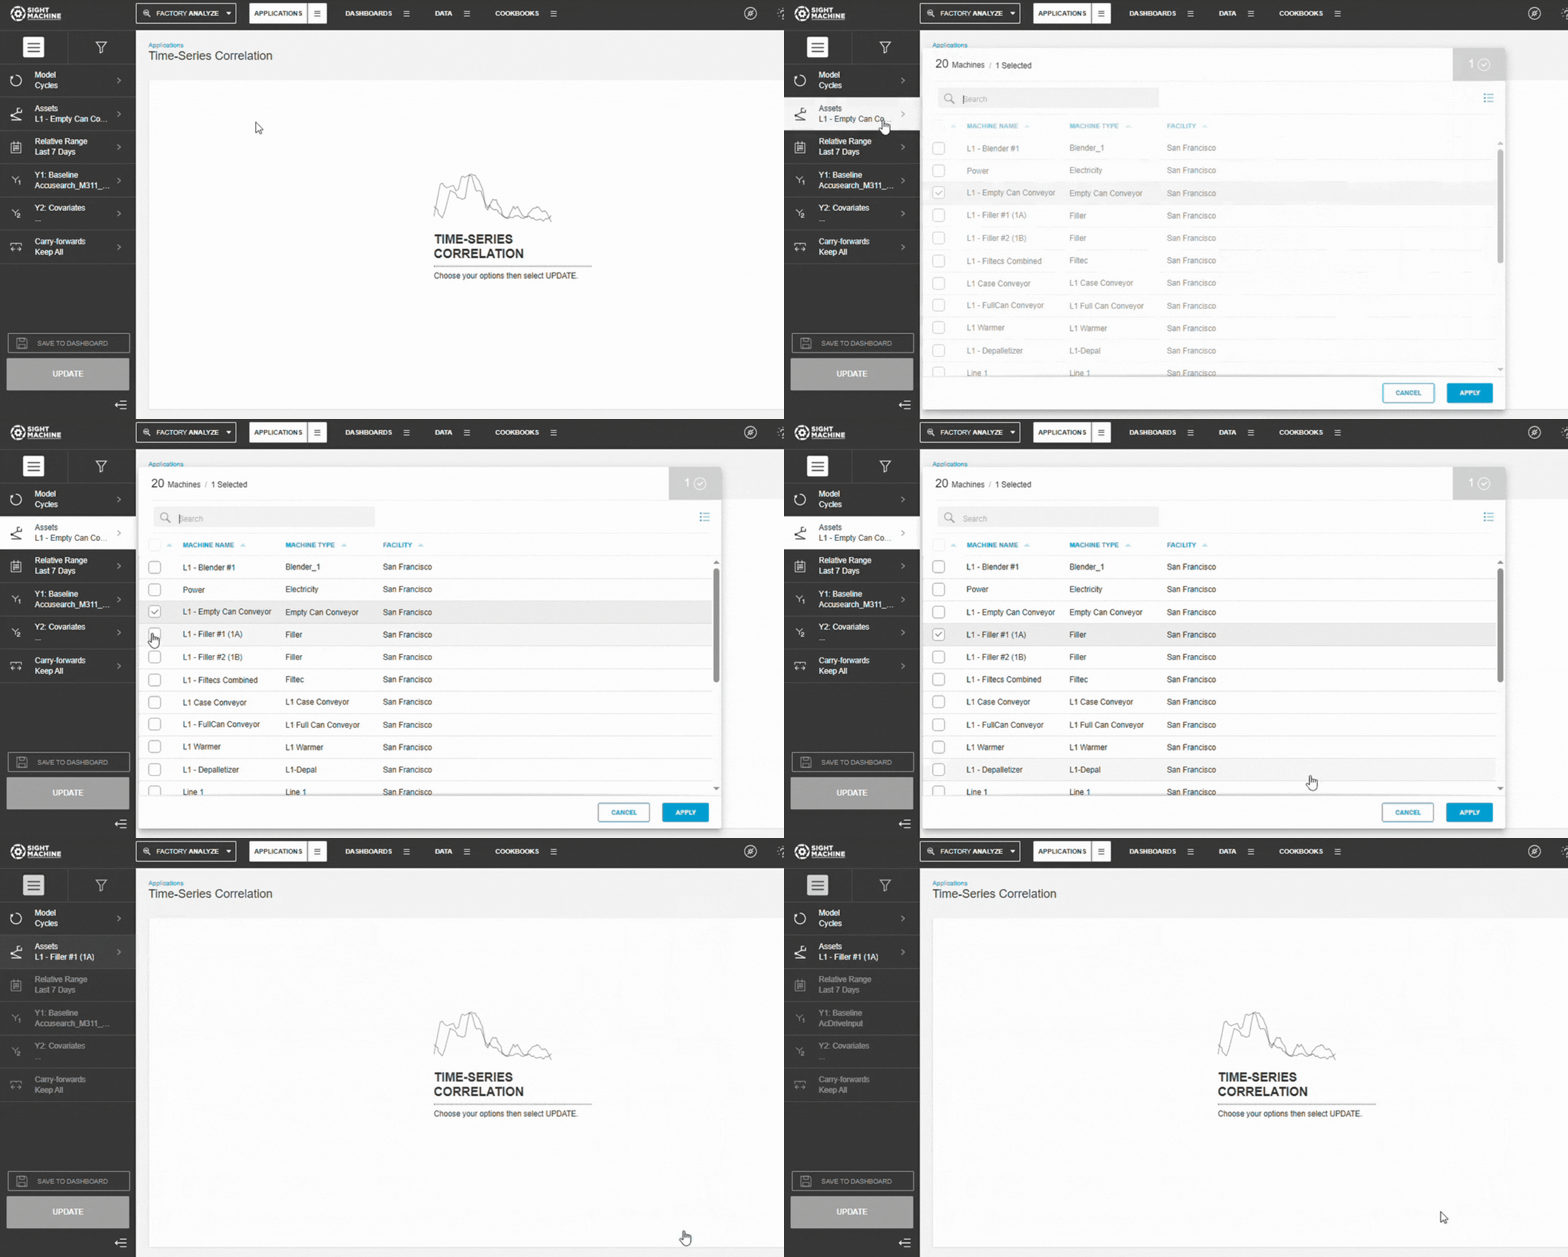
📝 Note: Selecting multiple similar assets increases sample size and improves correlation stability.
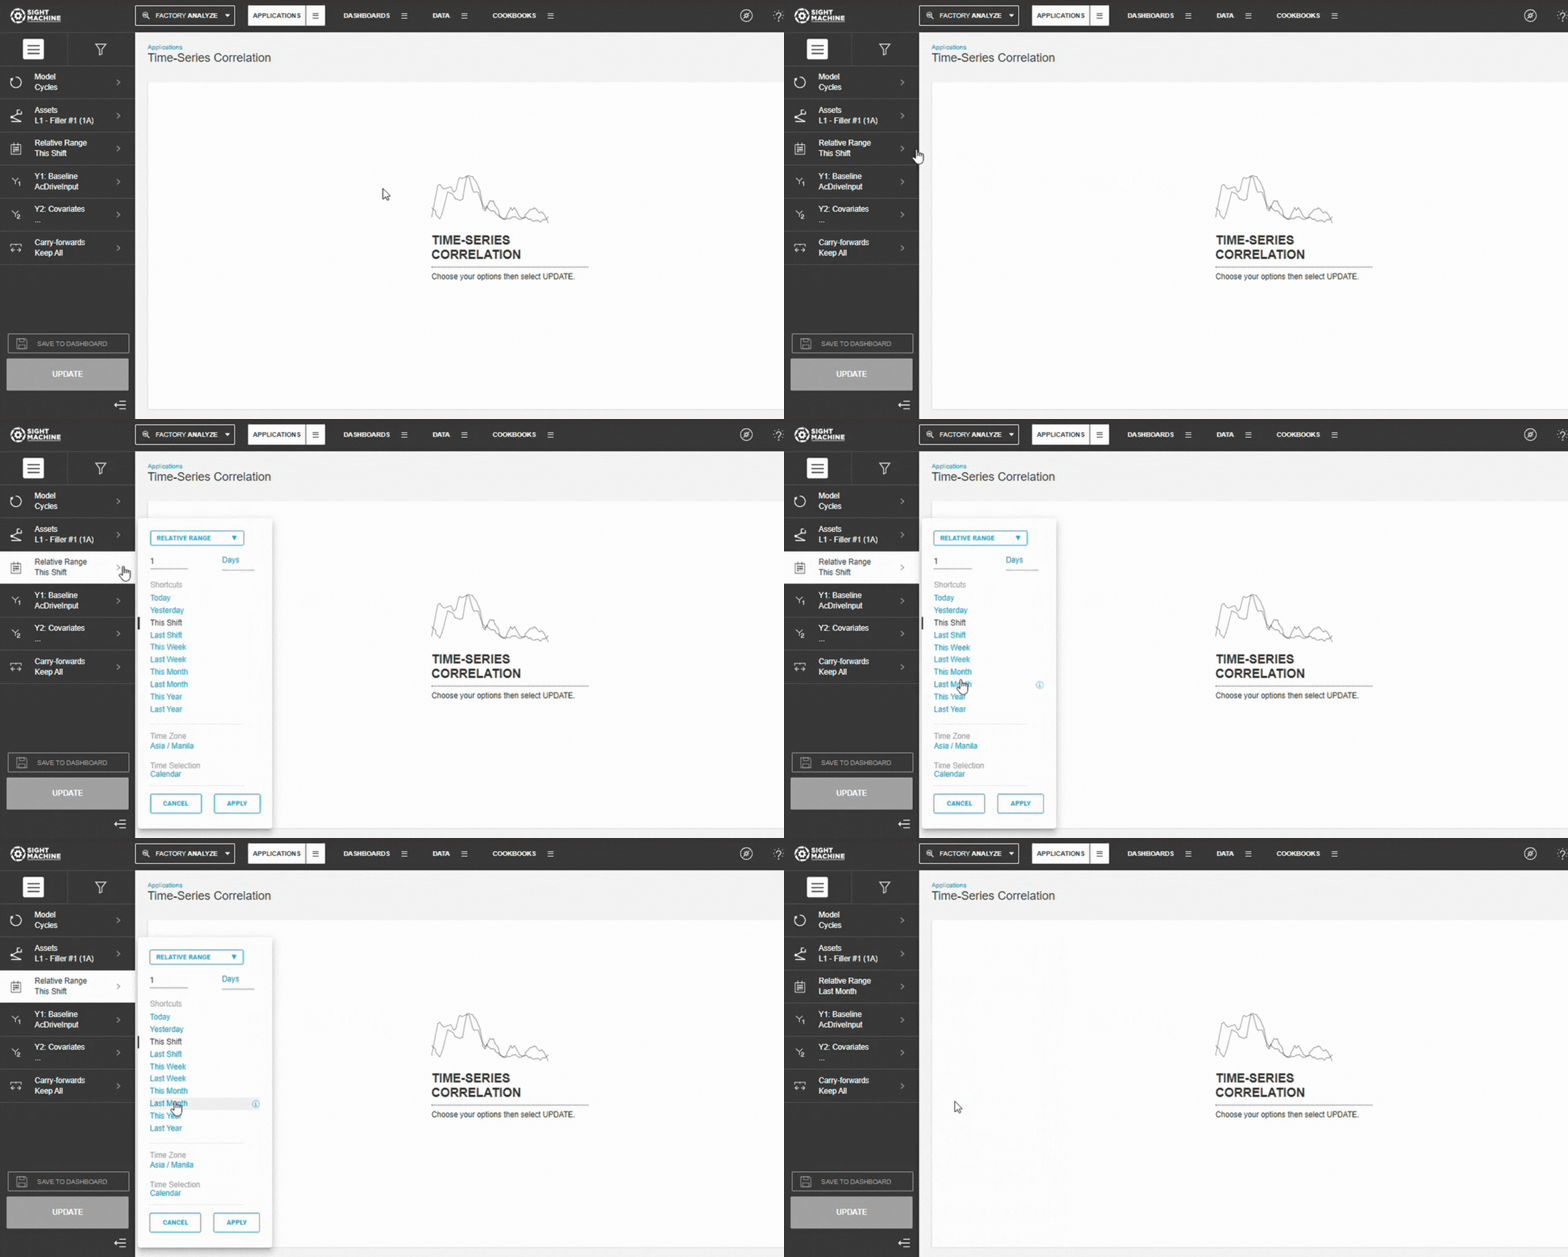
4. Set the Time Range
Choose:
- Relative range (Last 7/30/90 days)
- Absolute range (manual start/end dates)
5. Select the Target Parameter (Y1)
Choose the parameter you want to understand. Must be continuous and numeric.
Common examples: Quality Score, Yield %, Cycle Time, Energy Consumption
💡 Tip: Select an outcome metric tied to quality, performance, or efficiency.
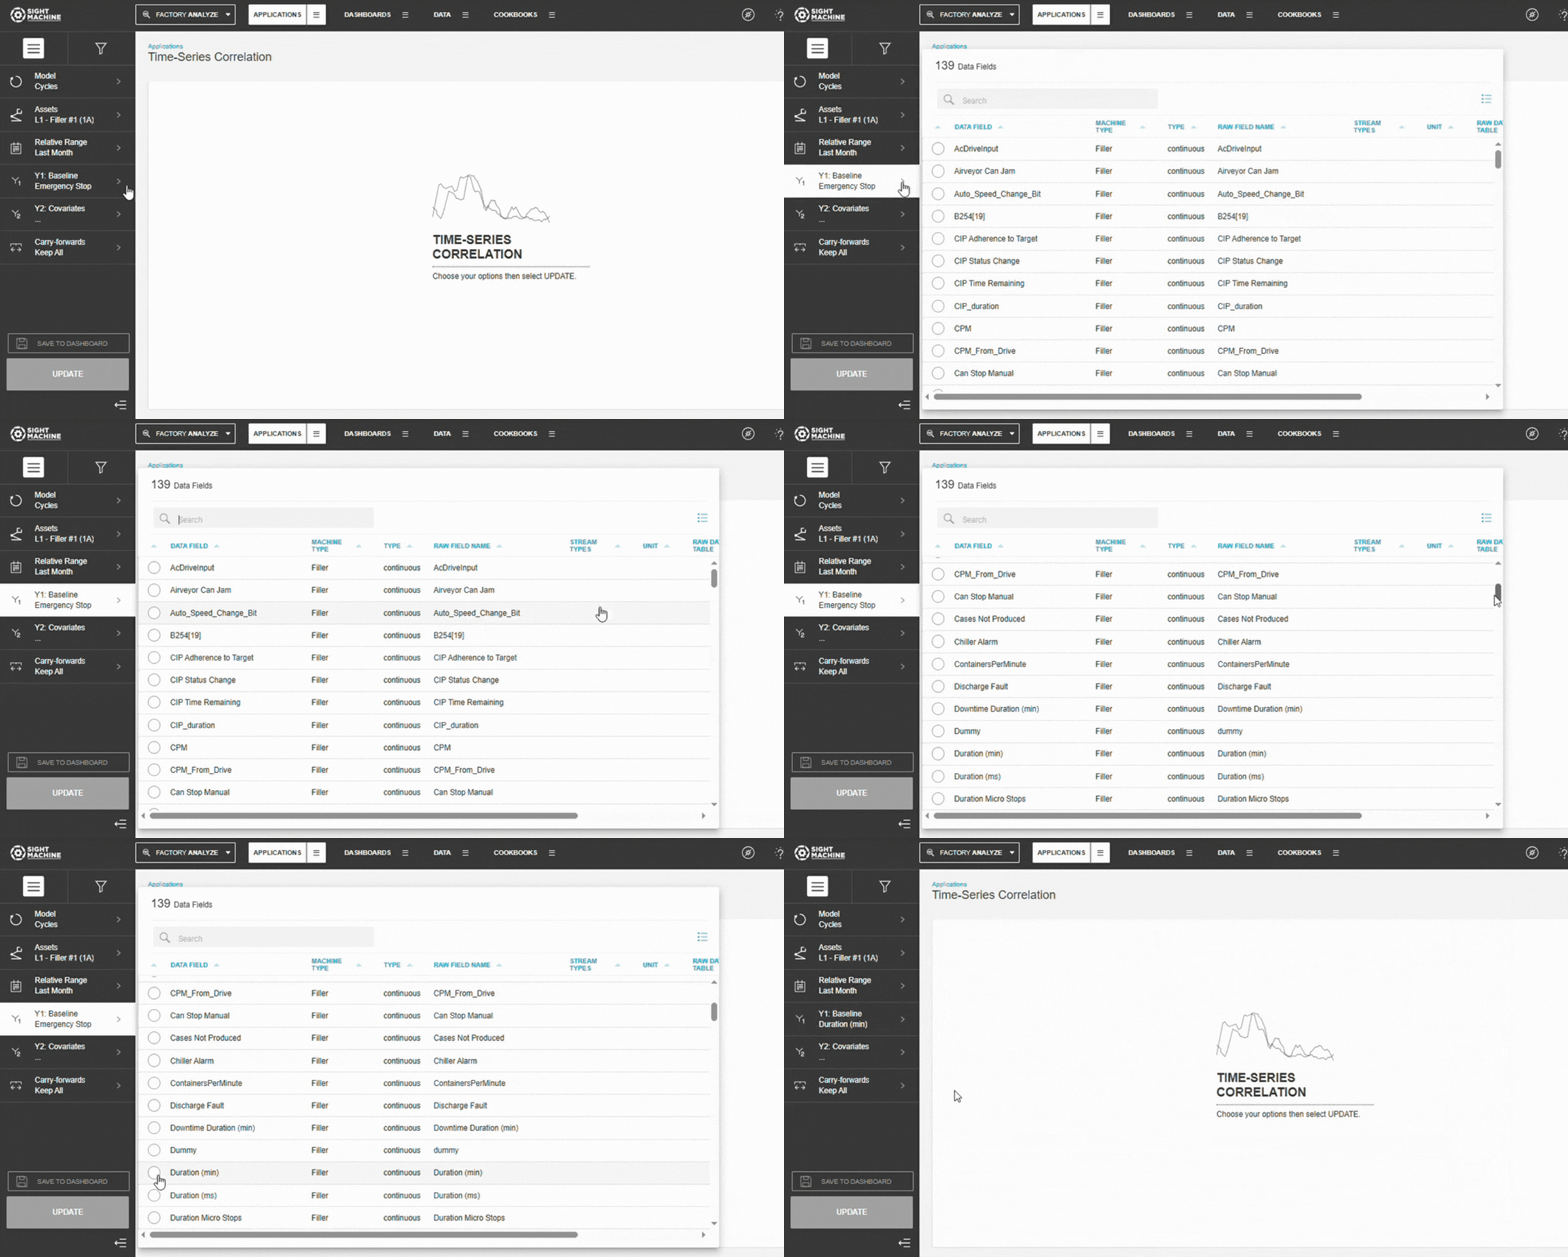
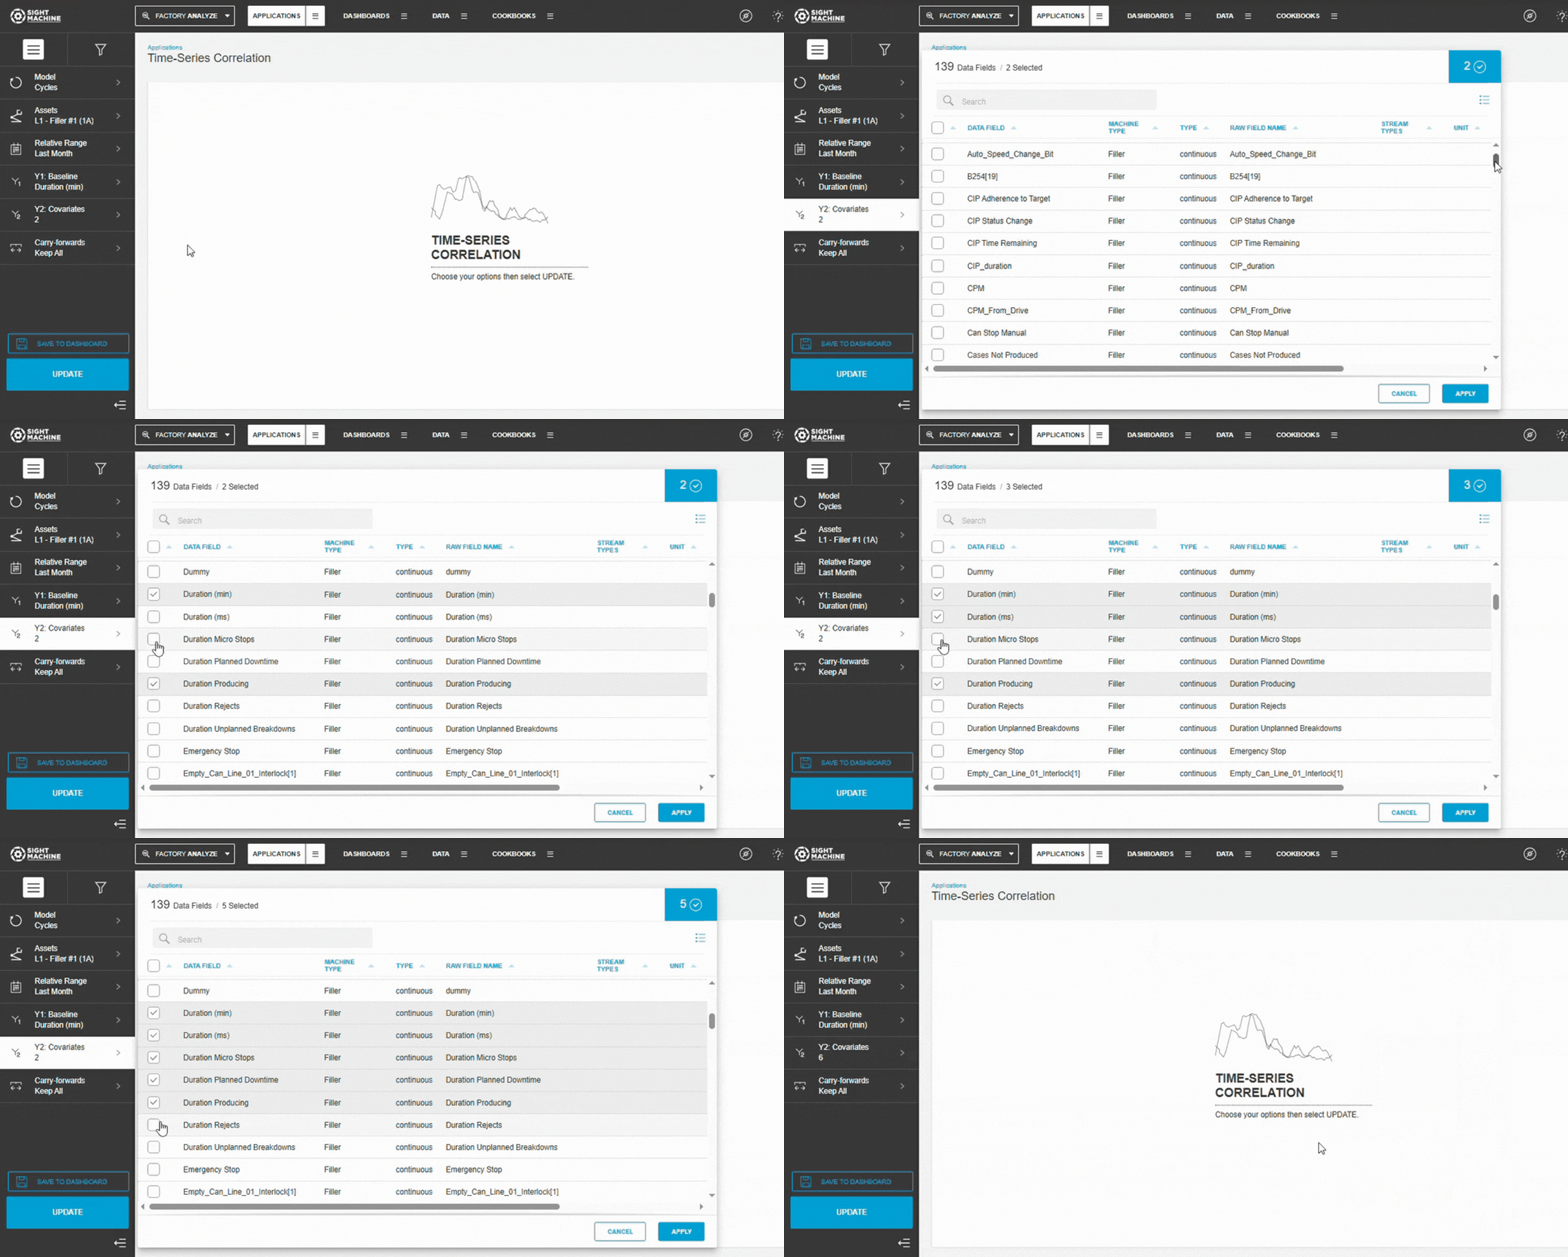
6. Configure Comparison Parameters (Y2)
The tool automatically:
- Identifies all continuous numeric fields
- Calculates correlations for up to 1500 parameters
- Ranks them by correlation strength
No manual selection required.
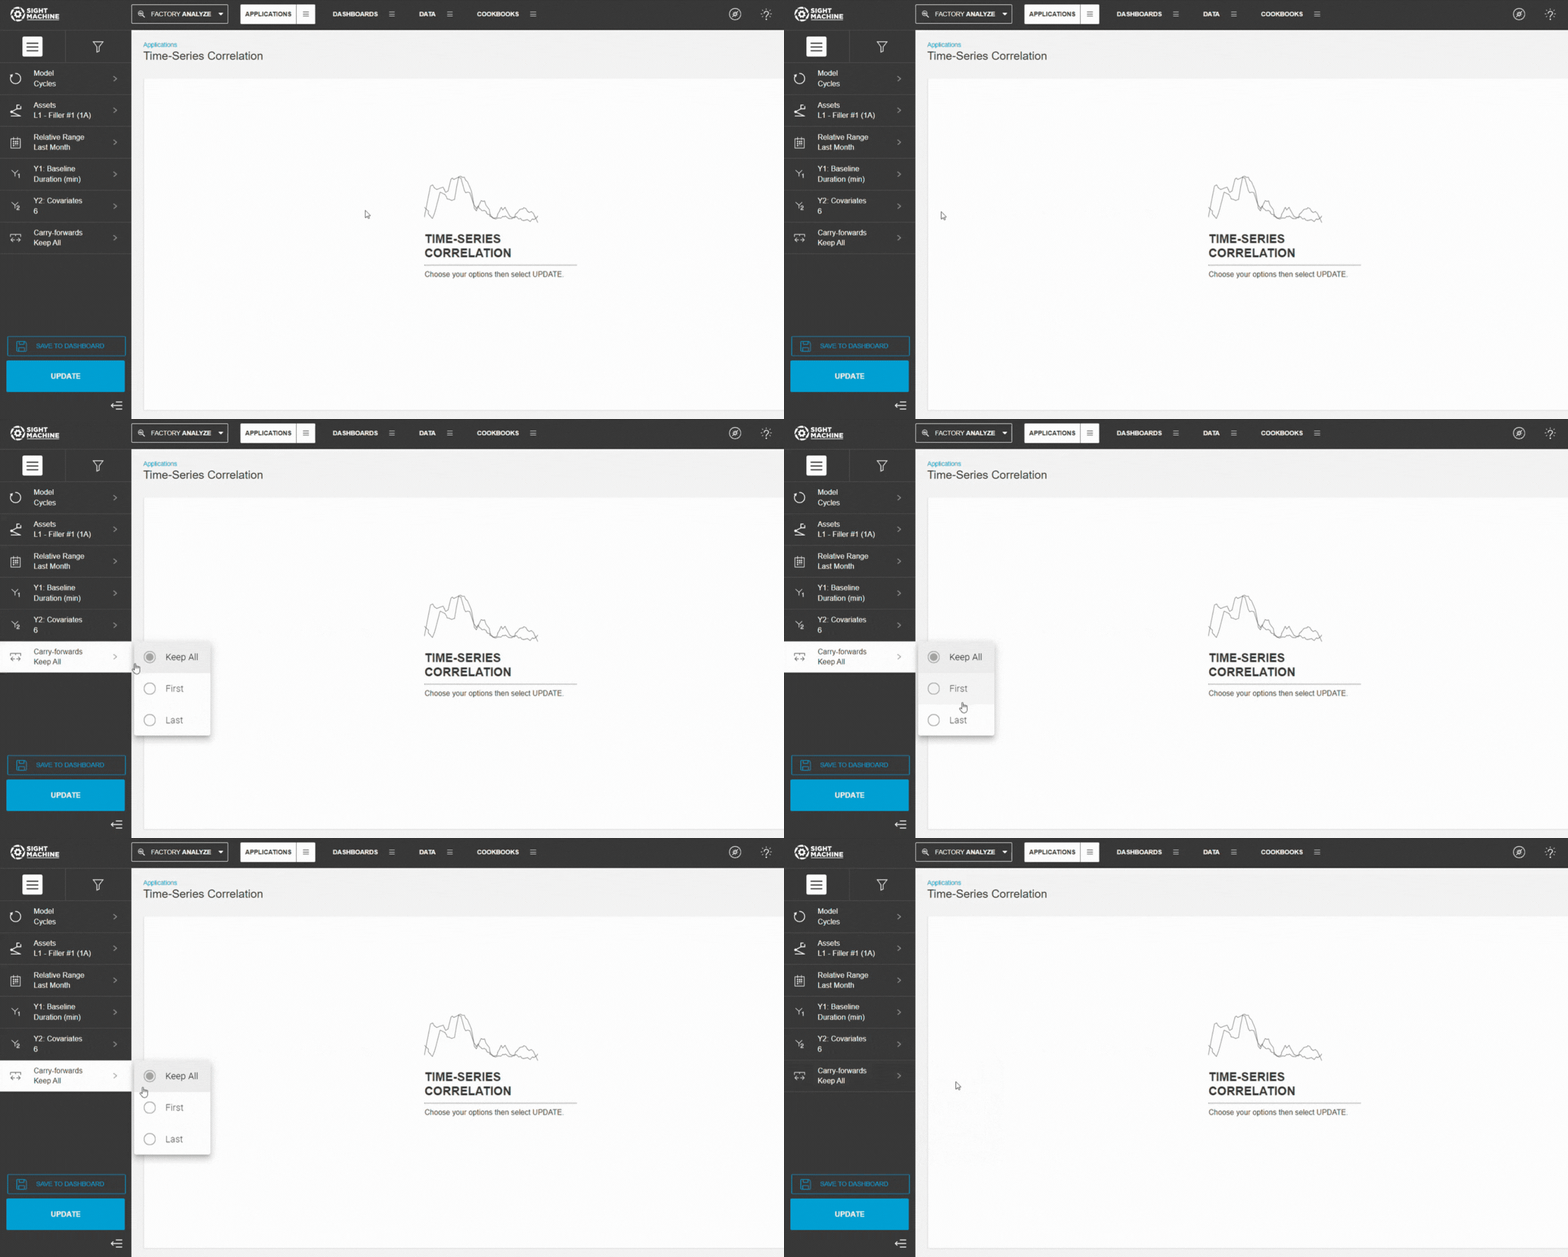
7. Configure Carry-Forwards
Choose how forward-filled values should be handled:
- Keep All (default)
- First
- Last
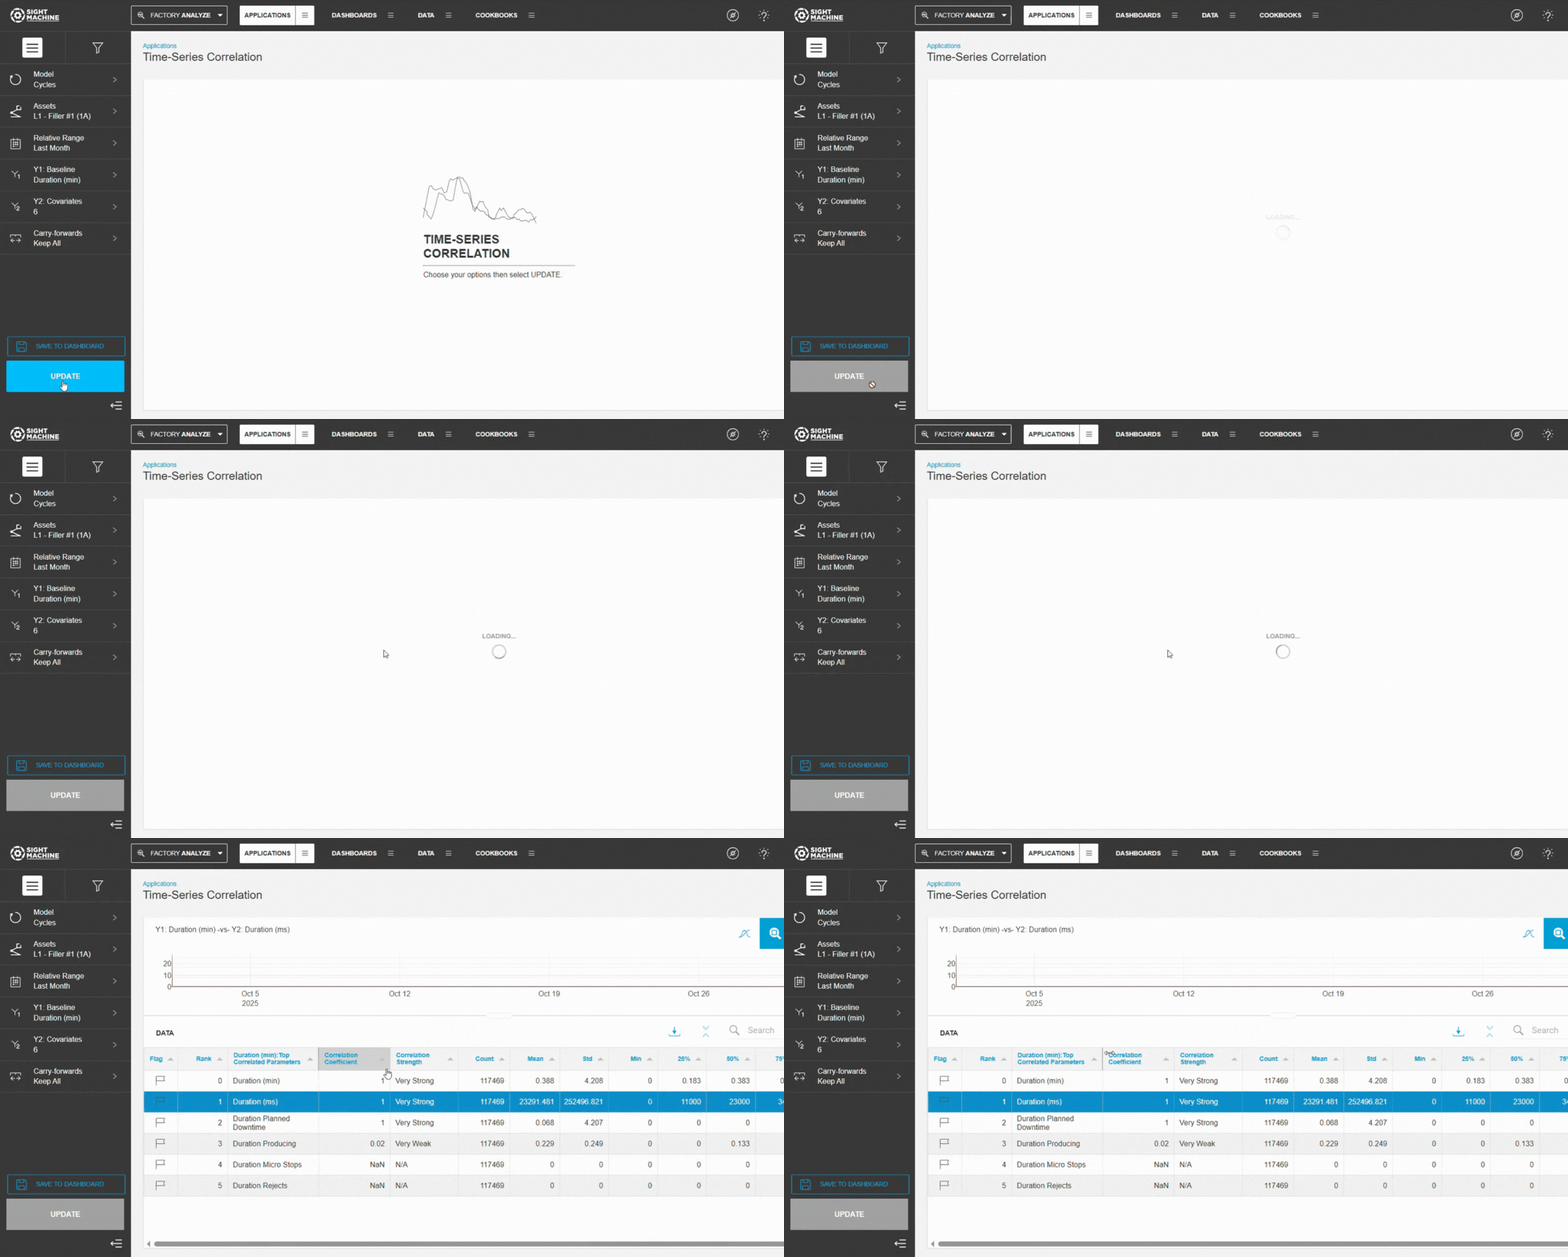
8. Generate Results
- Select Update.
- Wait for the analysis to run.
- Review the ranked correlations and time-series visuals.
How Time-Series Correlation Works
Pearson-R Correlation
The tool uses Pearson’s r to measure linear relationships.
Range: –1.0 to +1.0
- +1.0 → Move together
- –1.0 → Move opposite
- 0 → No linear correlation
Formula
r = (n × Σ(xy) - Σx × Σy) / √[(n × Σ(x²) - (Σx)²) × (n × Σ(y²) - (Σy)²)]
or
r = Cov(X,Y) / (σx × σy)
💡 Correlation is scale-independent.
Interpreting Results
| |r| | Meaning | Action |
|---|---|------------|--------|
| ≥ 0.7 | Strong | Investigate immediately |
| 0.5–0.7 | Moderate–Strong | High-priority follow-up |
| 0.3–0.5 | Moderate | Investigate if relevant |
| 0.1–0.3 | Weak | Low priority |
| < 0.1 | None | Ignore unless domain context applies |
Direction
- Positive: rise/fall together
- Negative: move inversely
- Near zero: no pattern
Data Requirements
Numeric parameters only
Categorical fields are excluded.
Cycles vs. Parts
- Cycles → same asset type
- Parts → multiple machines producing same part type
Time Alignment
Timestamps must match.
⚠️ Time misalignment weakens correlations.
Sample Size
- 30 min, 100+ ideal
Summary Statistics
Each pair includes:
- Count
- Min/Max
- Standard Deviation
💡 Low variability makes strong correlations unlikely.
Time-Series Visualizations
Each result includes:
- Target parameter (primary axis)
- Comparison parameter (secondary axis)
- Timestamp alignment
Use it to identify:
- Alignment (positive)
- Inverse patterns (negative)
- No pattern
- Time lags
Workflow Integration
From Correlation Heatmap
Use the Time-Series tool to deep-dive into specific relationships.
To Curve Fit Analysis
Use strong correlations to build predictive regression models.
Feature Benefits
- Automated Correlation Discovery: Significantly reduces manual effort by automatically scanning and ranking parameters with the highest correlation to your selected variable. This speeds up the initial phase of data exploration compared to traditional tools like the Correlation Heatmap.
- Univariate Focus for Multivariate Analysis: After selecting one primary parameter of interest. The tool then automatically compares it against all other continuous fields (excluding those you specifically exclude).
- Broad Model Applicability: Supports multivariate analysis across the Cycle, Parts, and Lines data models, providing flexible application depending on the desired level of granularity.
- High-Granularity Cycle Analysis: When used with the Cycle model, the tool provides the highest level of detail for investigating correlations within the same machine type.
- Cross-Machine Comparison: Utilizes the Part model to enable comparison of fields across different machines, critical for understanding how performance variables interact across the production process.
- Pearson-R Coefficient Calculation: The tool reliably computes the widely accepted Pearson-R correlation coefficient to quantify the magnitude and direction of the relationships between variables.
- Integrated Summary Statistics: Provides essential context for the identified variable pairs by displaying summary statistics (Count, Min, Max, Standard Deviation) alongside the time-series plots, aiding in deeper immediate analysis.
- Foundation for Deeper Analysis: Serves as an ideal exploratory starting point in the analytical process, easily identifying high-value correlations that can then be seamlessly transitioned to tools like Curve Fit Analysis for validation.
Related Topics
- Correlation Heatmap
- Curve Fit Analysis
- Scatterplot Matrix
- Statistical Process Control
- Timeline Analysis
Summary
Time-Series Correlation identifies which continuous parameters most influence a selected target parameter. It automatically calculates Pearson correlation coefficients, ranks the strongest relationships, and pairs each with time-series visuals to show how they behave over time.
The tool performs multivariate analysis by comparing your selected parameter on the Y-axis with all other continuous parameters, excluding any you choose, and highlights the strongest correlations. This reduces manual selection and speeds up early exploratory analysis.
Up to 1,500 parameters can be evaluated and ranked, making Time-Series Correlation a powerful starting point for process optimization, troubleshooting, predictive analytics, and follow-up analysis in tools like Curve Fit Analysis.