Overview
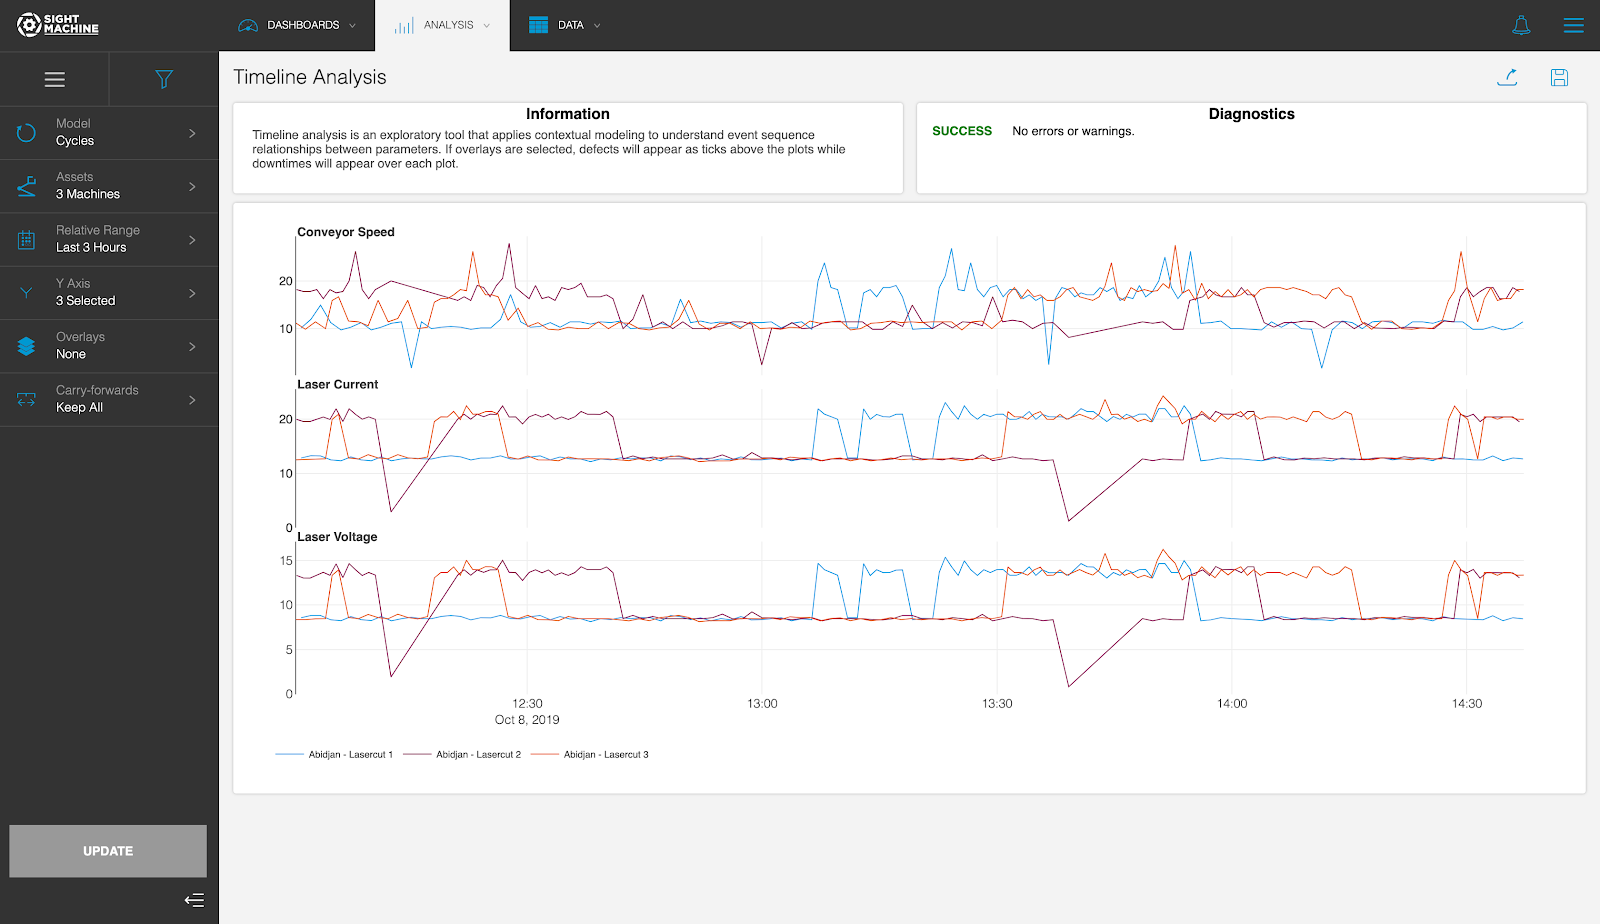
Timeline Analysis is a multivariate exploratory tool used to plot the behavior of multiple continuous parameters over a selected time range, often alongside downtime and defect events. It is most helpful early in the exploratory process for investigating patterns, anomalies, and parameter behavior leading up to or during specific events. It serves as a strong preliminary step that can guide subsequent, more detailed analyses like Descriptive Statistics or Time-Series Correlation.
Before You Begin
Ensure you have:
Access to the Application tab (or Analysis tab, as per your original document).
Permission to view selected assets or part types.
Up to five numeric (continuous) parameters available for plotting on the Y-axis.
A defined time range with available data.
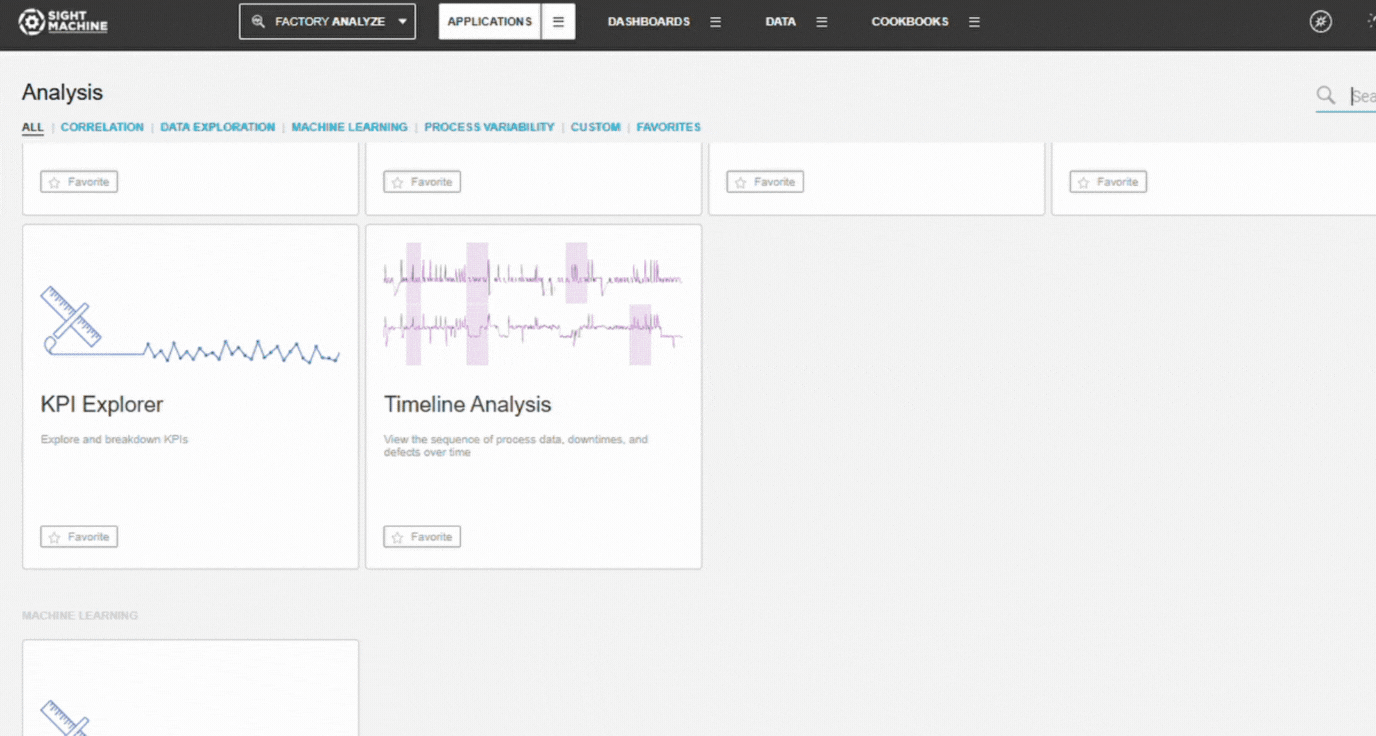
Create a Timeline Analysis
1. Open Timeline Analysis
Navigate to the Application tab (or Analysis tab).
Select Timeline Analysis.
The configuration panel will open.
2. Select a Data Model
Select how you want the tool to group data:
Cycles – Cycle-level parameters from the same asset or asset type.
Parts – Part-level data across different machines producing the same part type (limited by the part identifier).
💡 Tip: Use Cycles for high-granularity analysis within a machine and Parts for cross-machine comparison of final product characteristics.
3. Select Assets
Choose an Asset (Cycles) or Part Type (Parts).
Select one or more assets of the same type or the relevant part type.
Confirm selections in the left panel.
📝 Note: If you select multiple similar assets, each will be plotted with a different color, allowing for direct comparison of their parameter trends over time.
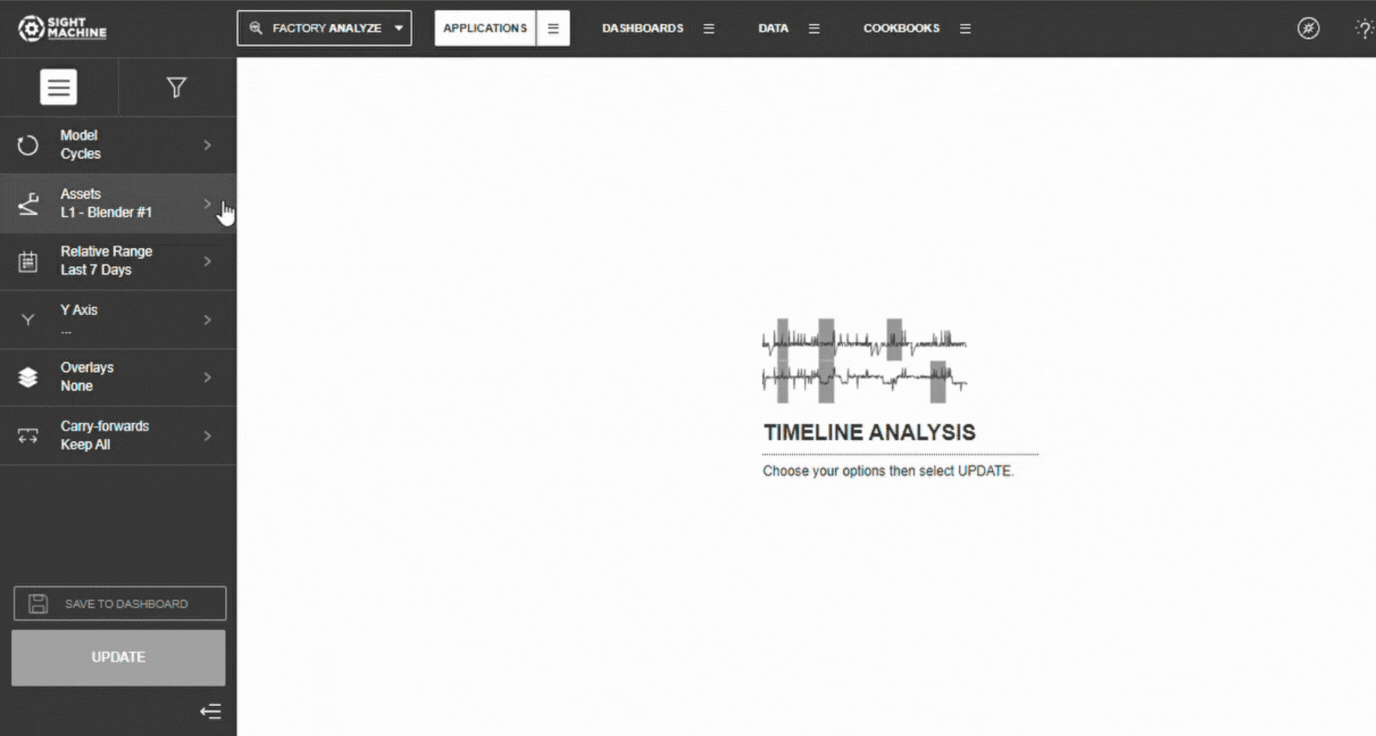
4. Set the Time Range
Choose:
Relative ranges (e.g., Last 7/30/90 days).
Absolute ranges (manual start and end dates).
📝 Note: This establishes the boundaries for the data that will be part of your analysis.
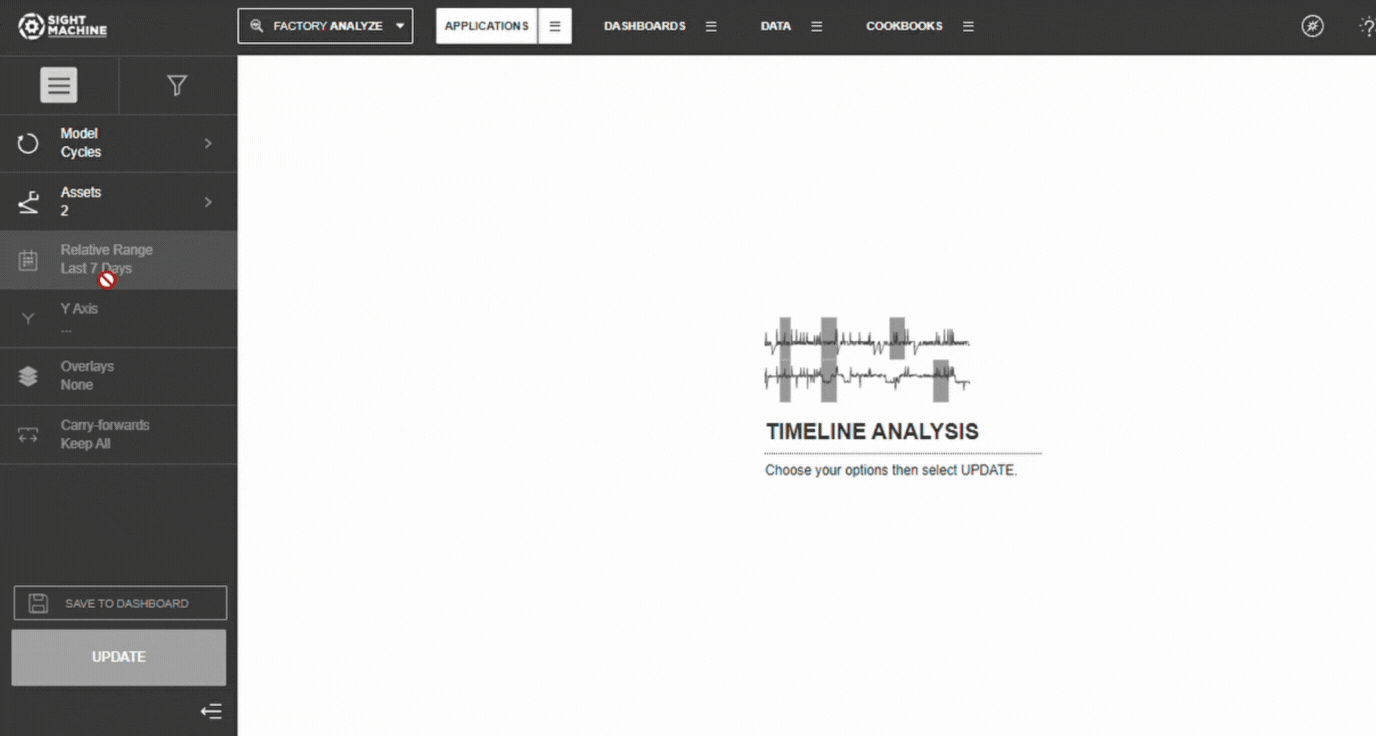
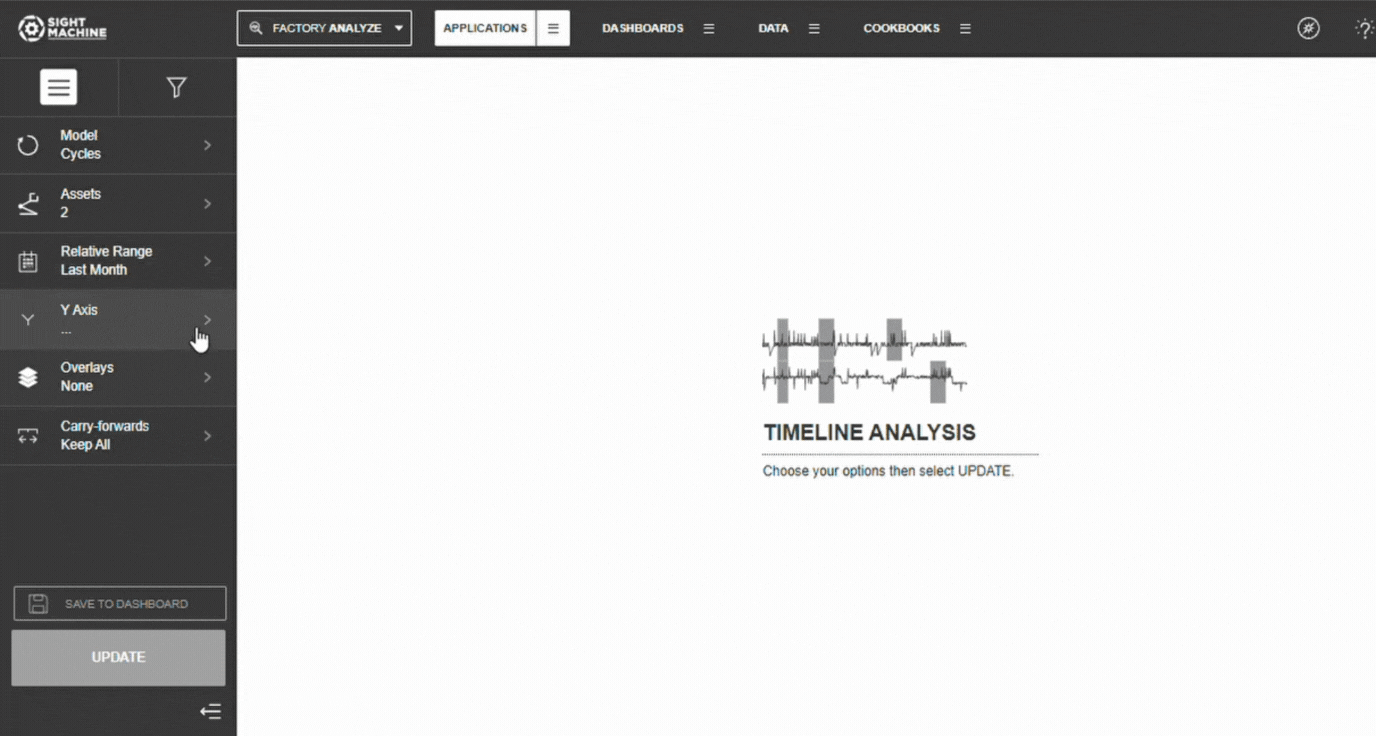
5. Select Y-Axis Parameters
Choose up to five continuous parameters to analyze.
Each parameter will be plotted as a separate time series chart, sharing the same time (X) axis.
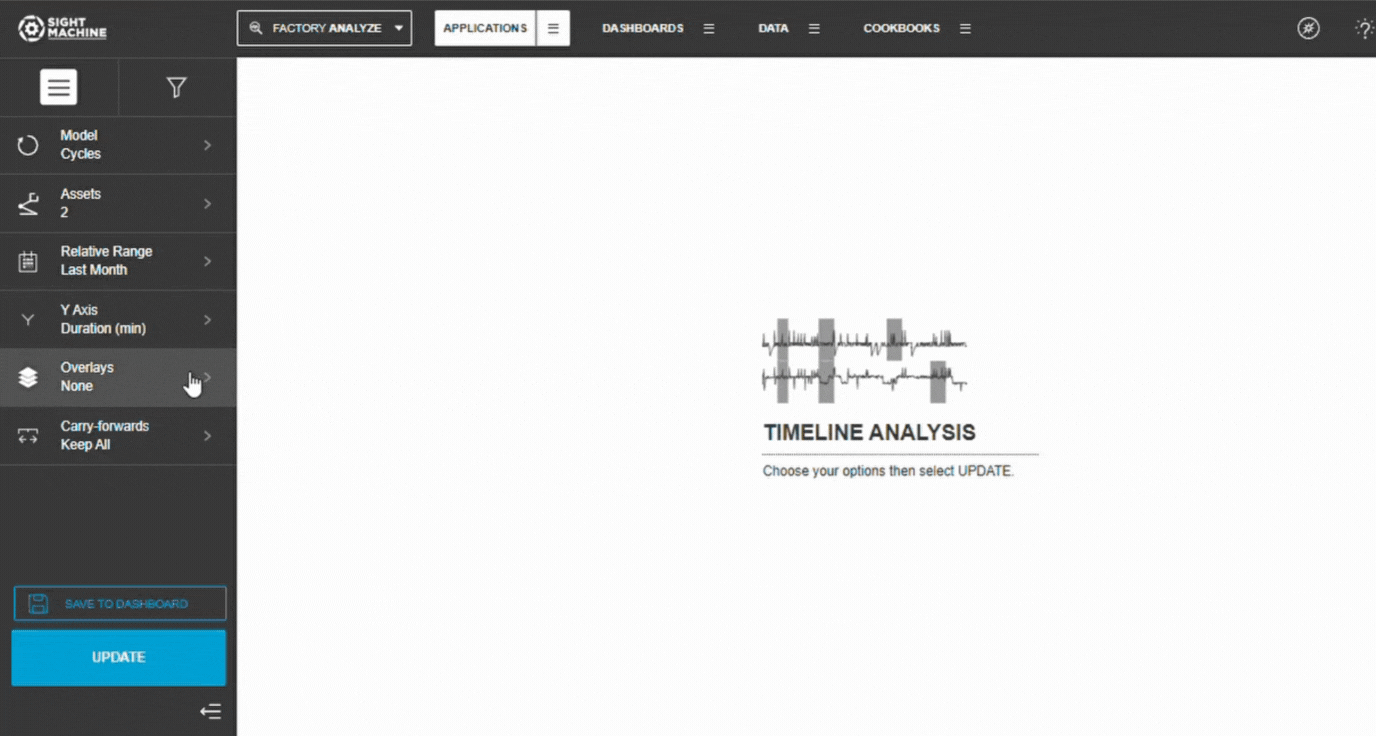
6. Add Overlays (Optional)
To investigate the relationship between parameter behavior and events:
Select whether to add Downtimes, Defects, or Both, as overlays on your chart.
Defects are typically shown as ticks at the top of the plot.
Downtime events are typically shown as overlaid bands on the plot.
7. Configure & Generate Time Series Results
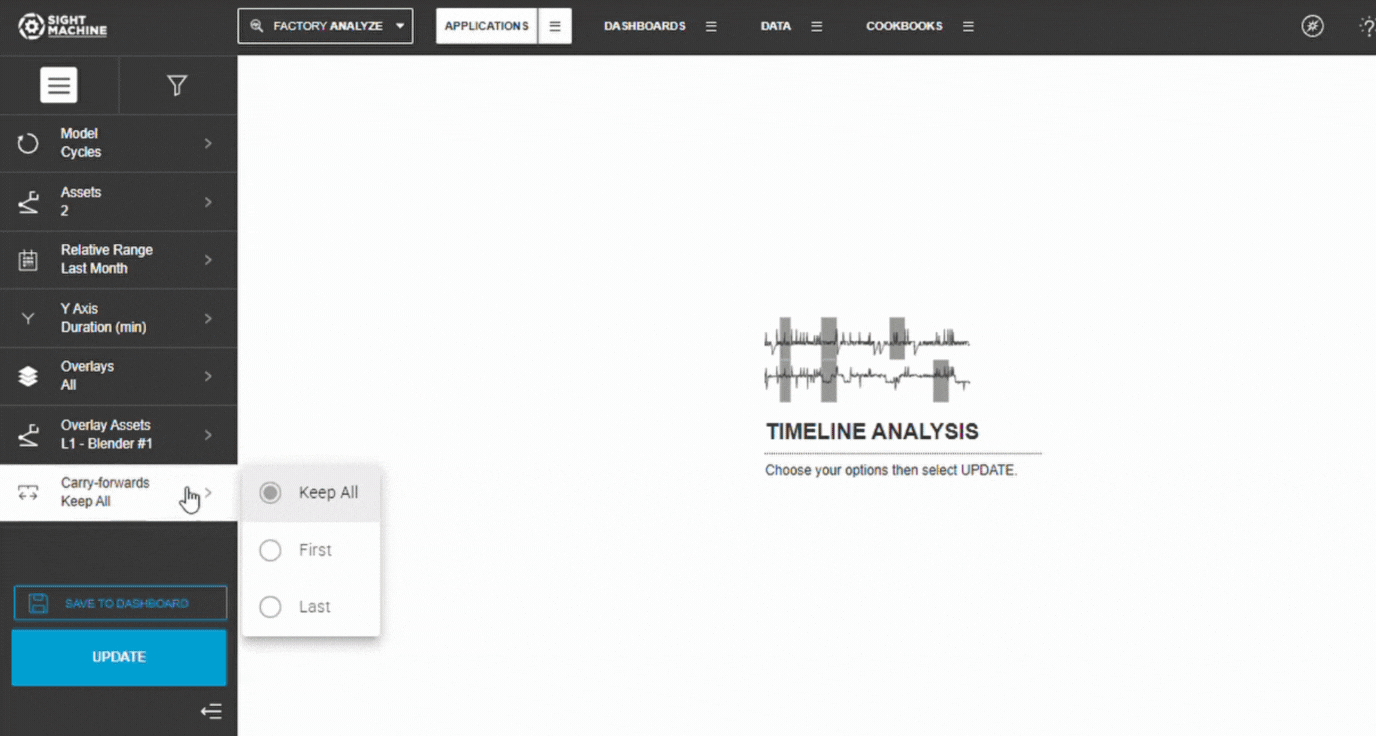
To complete the process in one step: Configure your desired Carry-Forwards setting (choosing from Keep All, First, or Last) and then select Update to Generate Results and load the time series charts for review.
Timeline Analysis Options
The Timeline Analysis options include:
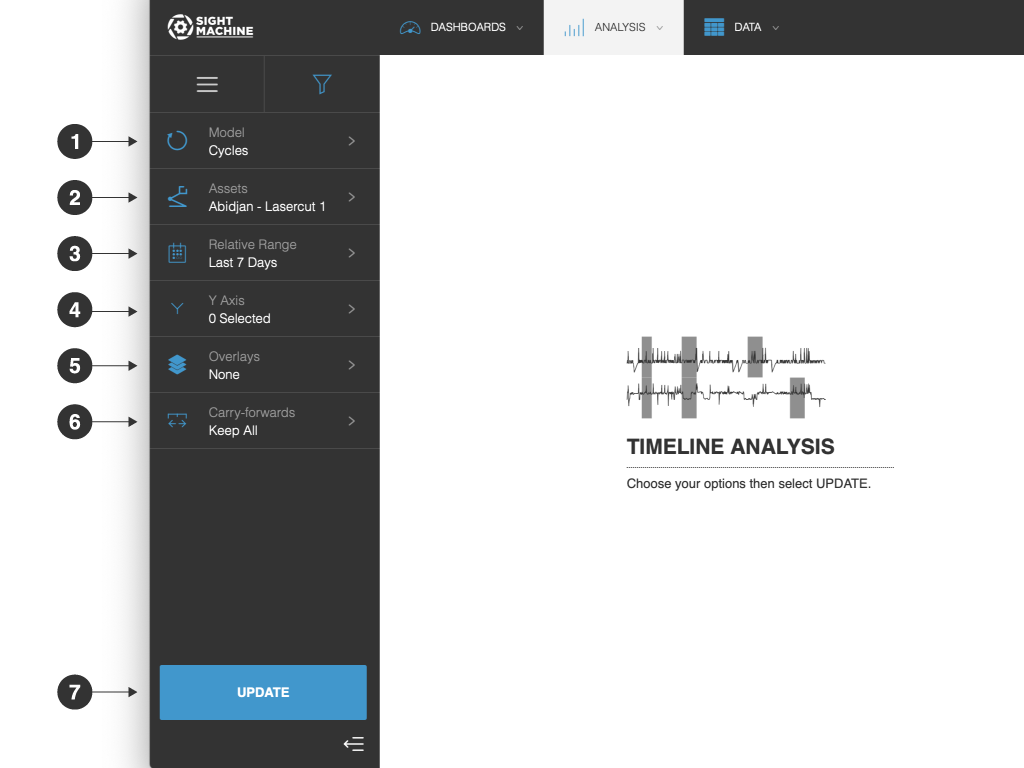
- Model: You can select:
- Cycles: Examine the correlation between two parameters in the same asset or asset type.
- Parts: Examine the correlation between two parameters across different machines producing the same part type.
- Assets: You can select assets to monitor. For example, to perform a Cycles analysis, you need to select an asset to analyze. For example, 3 specific machines. If you are using the Parts model, you need to select a part type.
- Relative Range: You can define a date range of data points to analyze for the assets you have selected. For example, select the last 7 days. This option establishes the boundaries for the near real-time data that will be part of your analysis. Select from relative or absolute timeframes.
- Y Axis: You can select up to 5 parameters to analyze.
- Overlays: You can select whether to add Downtimes, Defects, or both, as overlays on your Timeline Analysis.
- Carry-forwards: You can undo the forward-fill effect on any fields. Select from Keep All, First, or Last.
- Update: Click this button to generate your chart.
Feature Benefits
Pattern and Behavior Investigation: Helps in quickly identifying trends, shifts, or anomalous behavior in continuous parameters over time.
Multi-Parameter Visualization: Plots up to five parameters simultaneously across a shared time axis, enabling easy visual correlation between them.
Event Correlation: Allows for direct visual investigation of how parameter values change leading up to, during, or after downtime or defect events using chart overlays.
Comparative Machine Analysis: Supports plotting data from multiple machines, using different colors to show if machine-specific factors influence the parameter trends.
Model Flexibility (Cycle & Part): Supports multivariate analysis on Cycle (high-granularity) and Part (cross-machine) data models.
Interactive Zooming: Allows users to drag and zoom on the X-axis (time) to focus in on specific time periods for detailed inspection.
Summary
The Timeline Analysis tool outputs up to five time series charts sharing a common time axis, with optional overlays for downtime and defect events. This provides a clear, visual understanding of the behavior of multiple parameters over time and their relationship to discrete manufacturing events.
For example, if you select multiple machines, you can toggle the display of each machine’s values using the legend to isolate and compare their trends. This visual exploration is most useful early in the process to guide subsequent quantitative analysis.