Overview
Variance Analysis is a powerful exploratory tool used to identify and rank process parameters based on their level of variability. By analyzing multiple numeric fields simultaneously across the Cycle, Line, or Part models, the tool highlights which parameters are fluctuating significantly and which remain stable. This analysis is a critical first step in the troubleshooting process, allowing engineers to filter through hundreds of data fields to find the most likely candidates for root cause analysis.
Analysis
Variance Analysis computes the variance of all selected parameters over your selected date range. After ranking the parameters by their variance, the tool selects the top 10 parameters. For each parameter, the tool plots a histogram of their values over the date range and a table of summary statistics including Count, Standard Deviation, Minimum, and Maximum.
How to Use Variance Analysis
The Variance Analysis tool is an exploratory data tool that identifies parameters that have high levels of variance and are therefore good candidates for additional analysis. It is often one of the first steps in performing data analysis.
NOTE: This tool only works on numeric fields, not categorical fields such as Pass/Fail.
This tool is built on a Cycles model so it ignores variability that happens outside the cycle (non-production data), which could interfere with the analysis vs. traditional variance analysis done via spreadsheets. The Cycles model summarizes parameter readings for each cycle, eliminating noise from higher granularity readings that may be too detailed for an exploratory analysis. Raw data can be analyzed if needed using the Raw Data Visualization tools. For more information, see Generating a Raw Data Visualization.
To use a Variance Analysis:
- On the Analysis tab, under Process Variability, click Variance Analysis.
- On the main Variance Analysis screen, select your options on the left. For more details about each option, see Variance Analysis Options.
- Click Update.
Variance Analysis Options
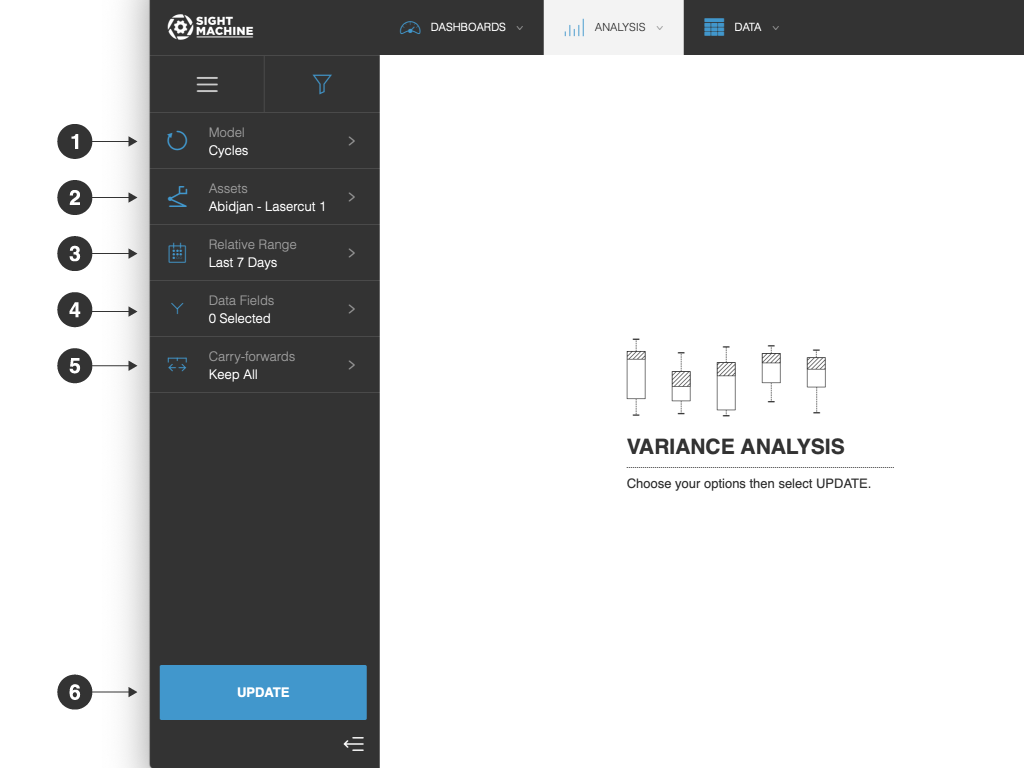
The Variance Analysis options include:
- Model: You can analyze only cycles for a specific asset (that is, machine). You cannot change this option.
- Assets: You can select one or more assets of the same type to analyze.
- Relative Range: You can define a date range of data points to analyze for the assets you have selected. For example, select the last 7 days. This option establishes the boundaries for the near real-time data that will be part of your analysis. Select from relative or absolute timeframes.
- Data Fields: You can select data fields to analyze.
- Carry-forwards: You can undo the forward-fill effect on any fields. Select from Keep All, First, or Last. For more information, see the table in Options Common to All Analysis Tools.
- Update: Click this button to generate your chart.
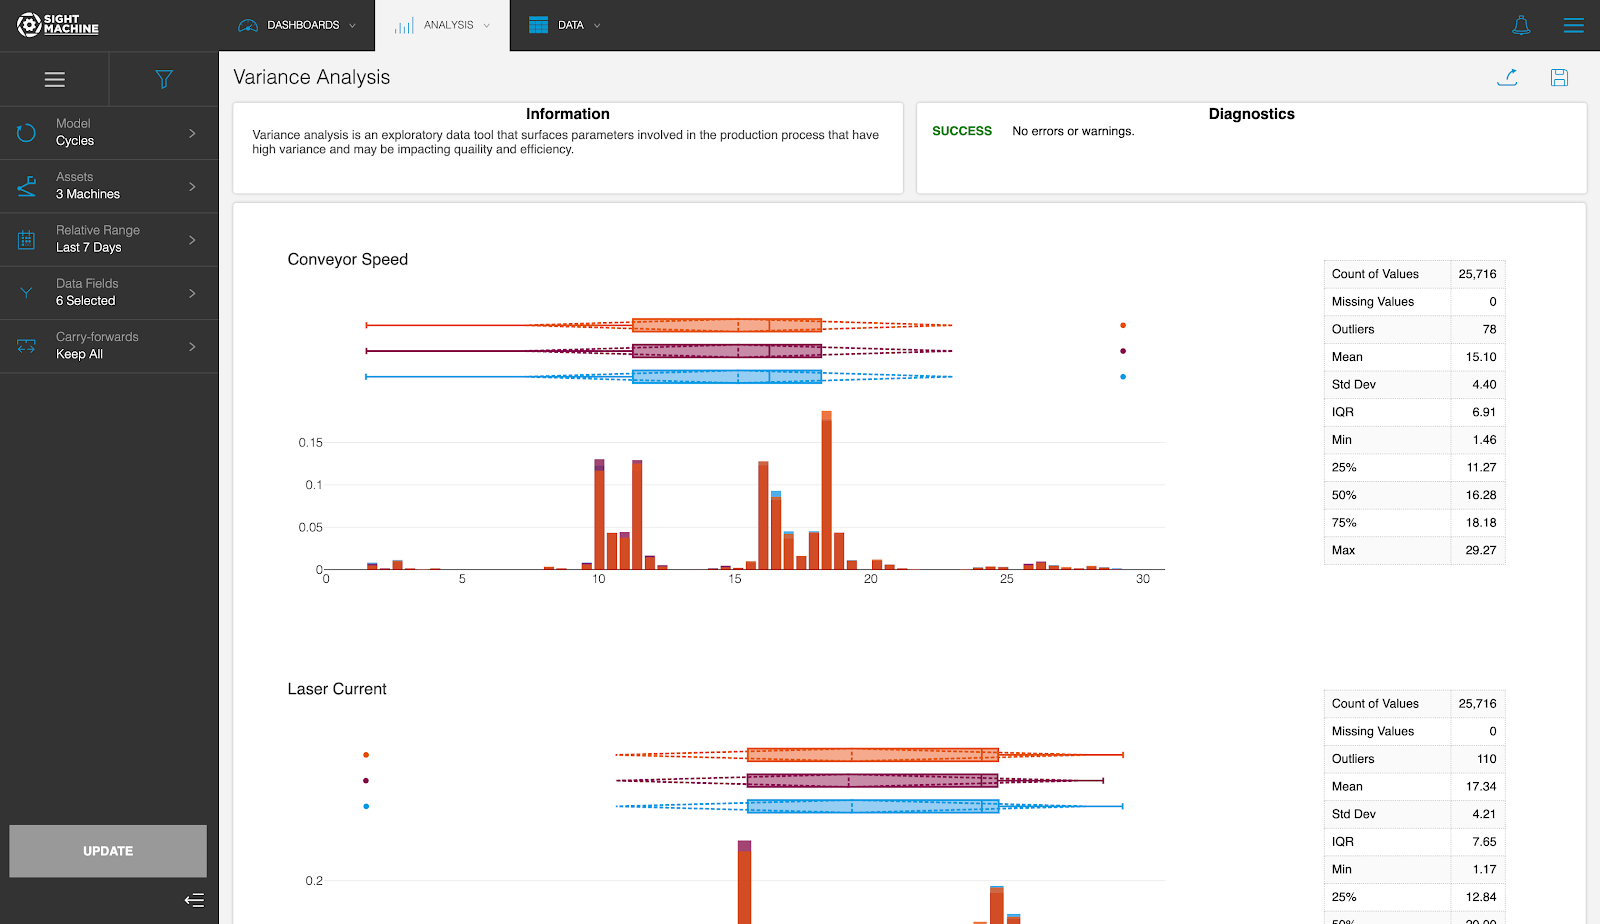
Tool Output
The Variance Analysis tool displays and ranks the 10 parameters from this asset that exhibit the highest amount of variability.
A histogram for each parameter lets you visualize the overall distribution of its values. A box plot for each parameter lets you visualize the overall distribution, quartiles, and the standard deviation. This helps you determine the top parameters that are good candidates for further investigation.
Variance Analysis 2.0
The latest version of the Variance Analysis application in Factory ANALYZE lets you study the variability of a large number of process parameters simultaneously.
There is no limit on the number of data fields that you can analyze. The Data Field picker in the sidebar lets you Select All available fields. After you select the data fields, the Variance Analysis tool displays and ranks all of the parameters in order of the highest amount of variability.
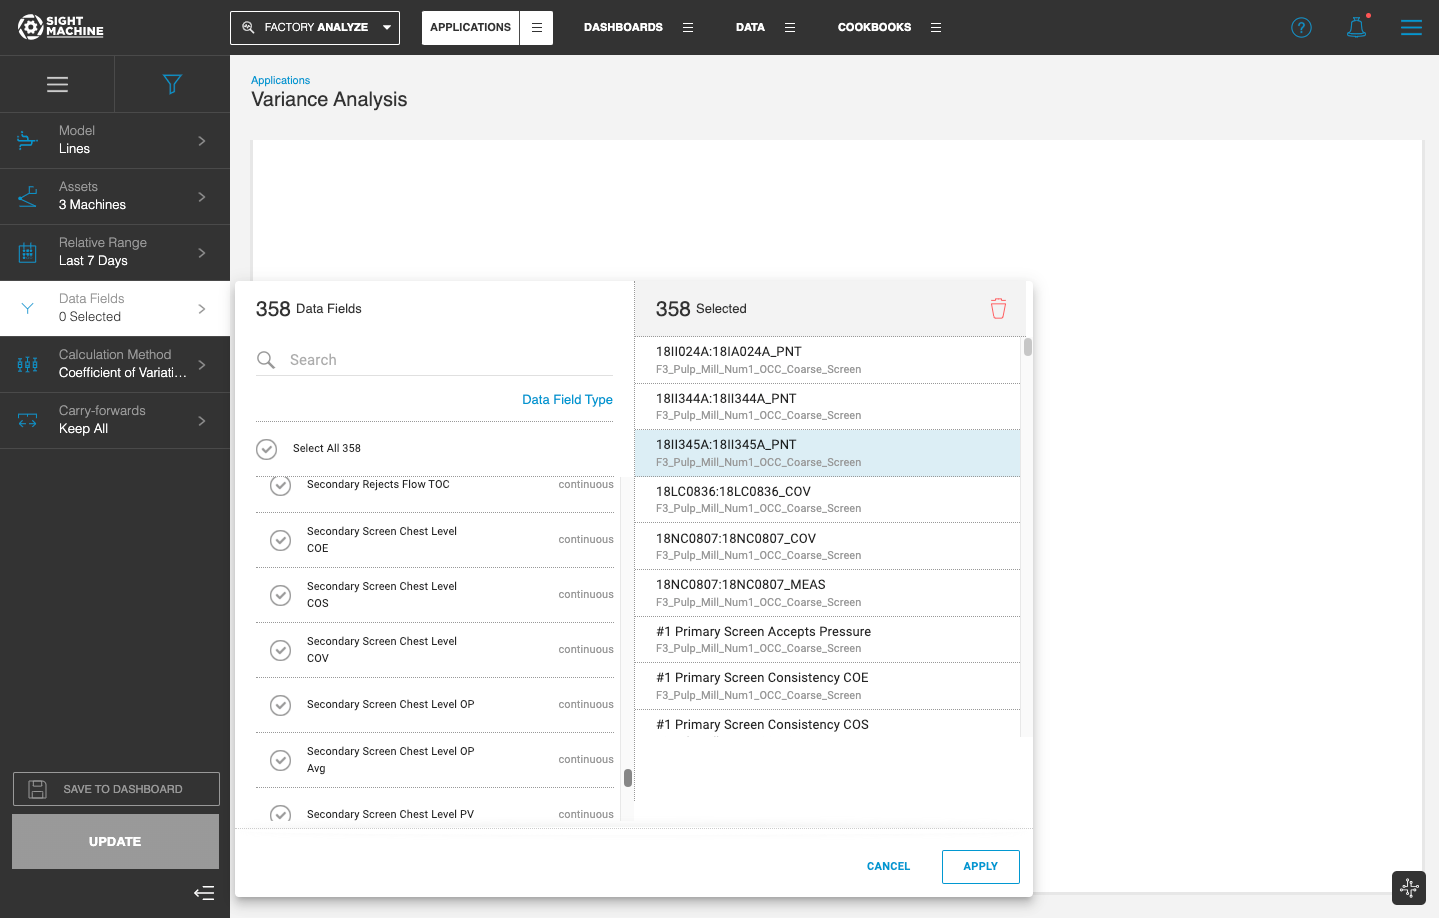
Parameters with little to no variation over the selected Time Range are not displayed in the Results table, but rather on the Information & Diagnostics tab.

The tool displays the histogram and the box plot for each parameter. The results table also presents the numerical values for various statistical properties.
You can select a Display mode and select the Chart and Table, Chart, or Table option, with the default display set to the parameter with the highest variation.

In the Chart and Table view, you can click through the table to update the visualization for the selected parameter.
The default method for ranking the parameters is based on computing and comparing the Coefficient of Variation for all selected data fields. The Standard Deviation method is also available as an option for the Calculation Method.
Variance Analysis supports the Cycles, Lines, and Parts data models, enabling powerful analysis across multiple Machine Types.
Feature Benefits
Automated Parameter Ranking: Automatically computes and ranks parameters by their variability, typically using the Coefficient of Variation to ensure a fair comparison between fields with different units or scales.
High-Volume Multivariate Support: Supports the simultaneous analysis of an unlimited number of data fields, allowing users to "Select All" to quickly scan an entire asset or line for instability.
Production-Focused Accuracy: Built on the Cycle model, the tool isolates variability occurring during active production, filtering out "noise" from idle time or non-production events that often skew traditional spreadsheet analysis.
Comprehensive Visual Diagnostics: Delivers integrated histograms and box plots for each parameter, providing an immediate visual understanding of data distribution, quartiles, and standard deviation.
Cross-Model Flexibility: Enables powerful comparisons across different machine types and production stages by supporting Cycles, Lines, and Parts data models.
Summary
The Variance Analysis tool serves as a "filter" for the exploratory process, transforming vast amounts of raw numeric data into a prioritized list of actionable insights. By ranking parameters from highest to lowest variability and providing detailed summary metrics (Count, Min, Max, and Std Dev), it effectively points users toward the most significant process fluctuations.
Whether using Variance Analysis 2.0 to scan hundreds of fields across a factory line or focusing on specific machine cycles, this tool ensures that subsequent investigations—such as Time-Series Correlation or Descriptive Statistics—are focused on the parameters that truly impact process stability.