What are KPIs
KPIs are dynamic calculations across different bins and attributes, ensuring flexibility and adaptability in monitoring performance metrics. Once activated, these fields are available within seconds in ANALYZE and are ready to be used with Data Visualization or Cookbooks.
Restrictions
Deployed Workspace: KPIs can only be activated within workspaces where a pipeline has been deployed.
Activation: KPIs can only be used when they are activated.
Usage
Runtime Fields: Runtime Fields can be used and referenced in your KPIs.
Accessing KPIs
This guide explains how to access your KPIs
Step 1: Navigate to STRUCTURE.

Step 2: Select the KPI chip for a Workspace in the Workspace Manager
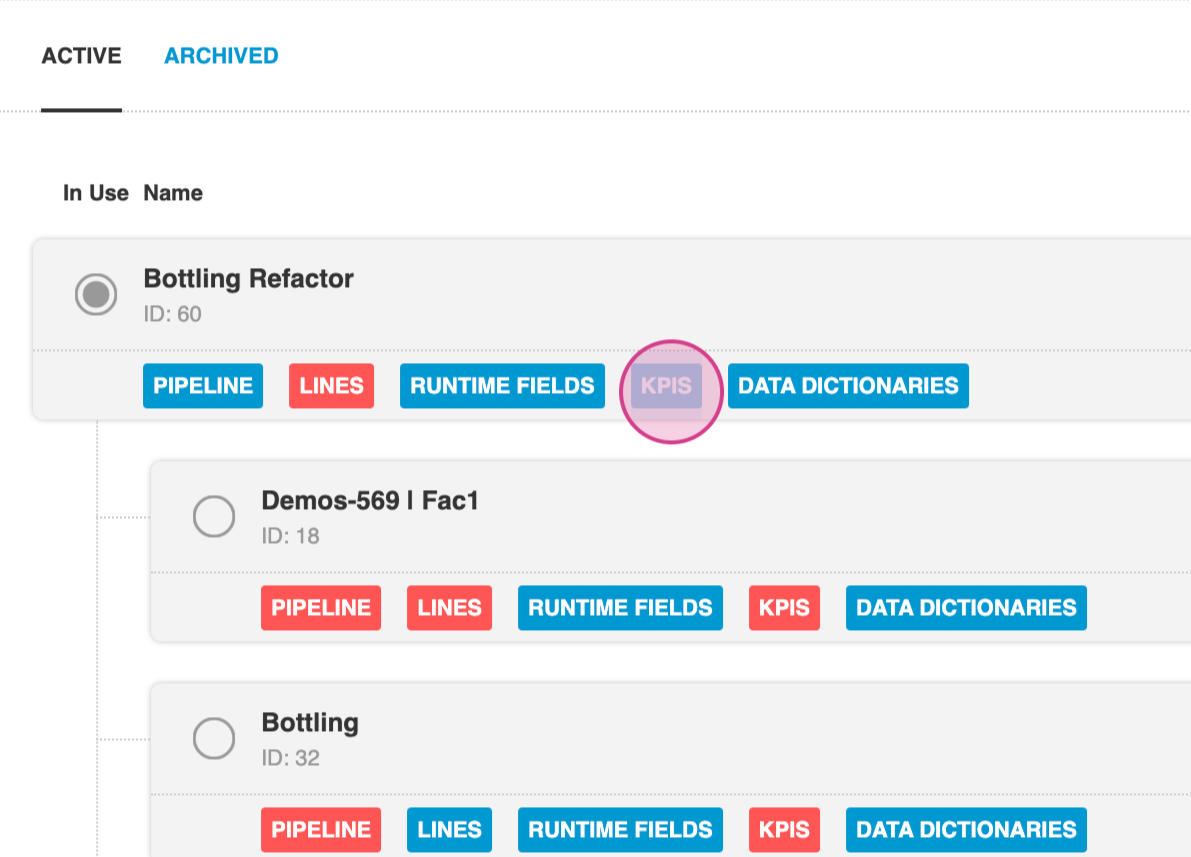
Step 3: After clicking, a page displays all available KPIs for the selected workspace.

Categories of KPIs
There are 2 types of KPIs available in SightMachine, Machine Type and Line KPIs
Machine Type KPIs
Defining a Machine Type KPI
Machine Type KPIs are designed to evaluate the performance of individual machines or compare performance across multiple machines of the same type. These indicators play a key role in tracking metrics such as machine efficiency, uptime, and output rates. Each KPI is uniquely designed for specific machine types, referencing only attributes pertinent to that machine.
Configuring a Machine Type KPI
name (required): Raw field name for the KPI.
display_name (required): Display name for the KPI shown in the UI.
formula (required): Mathematical expression to calculate the KPI.
dependencies (required): List of objects specifying aggregate functions for the variables in the formula, which must have the same name.
name: Variable name as it will be referenced in the formula
aggregate: Aggregate function for the variable. It must be one of sum, min, max, avg.
field_maps (required): List of objects mapping KPI dependencies to actual database column names.
alias_map (required): Object mapping each dependency, using the name defined for it, to the raw field name. Multiple mappings are only required if different machine types map to dependencies differently
name (required): Raw field name (you can user Field Explorer to find this string)
machine (optional): Specific machine used for this KPI field. Each machine will have the KPI available to them
row_formula (optional): Applies per-row, pre-aggregation transformations to the KPI's dependencies--uses the same syntax as runtime fields.
unit (optional): Unit of measure for the KPI (e.g., %, pounds).
rollups (optional): Object containing mappings for factory and line rollups. Rollups are used when computing aggregate KPIs for lines and factories on the homepage.
factory: Mapping of factory names to machine lists.
line: Mapping of line names to machine lists.
directionality (optional): Indicates if higher values are better ("positive") or lower values are better ("negative").
good_threshold (optional): Threshold above which the KPI is considered "good".
bad_threshold (optional): Threshold below which the KPI is considered "bad".
Restrictions on a Machine Type KPI
Machine Type KPIs are available within the KPI and Lines models but can only reference attributes within a given machine type.
Within the field_maps, Machine Type KPIs do not require a single
machineto be specified for each dependency because they automatically retrieve and aggregate data from all machines in the query.
Machine Type KPI Example
{
"bad_threshold": 60,
"dependencies": [
{
"aggregate": "sum",
"name": "Record_Duration"
},
{
"aggregate": "sum",
"name": "Duration_Planned_Downtime"
}
],
"description": "",
"directionality": "positive",
"display_name": "% Planned Downtime",
"field_maps": [
{
"alias_map": {
"Duration_Planned_Downtime": {
"name": "stats__Duration Planned Downtime__val"
},
"Record_Duration": {
"name": "stats__Duration (min)__val"
}
},
"machine_types": [
"mt_filler"
]
}
],
"formula": "((Duration_Planned_Downtime/Record_Duration)*100) if (Record_Duration > 0) else 0",
"good_threshold": 80,
"name": "percentage_of_time_in_planned_downtime",
"rollups": {
"factory": {},
"line": {}
},
"unit": "%"
}
}Line KPIs
Defining a Line KPI
A Line KPI evaluates the productivity of an entire production line rather than individual machines. These KPIs are associated with a specific machine but take into account data and attributes from multiple machines along the production line. An example of a Line KPI is yield measurement, which could calculate the total output efficiency of a production line by comparing the input at the start of the line (first machine) with the output at the end of the line (last machine). This approach provides a holistic view of the production line's effectiveness in converting inputs to outputs.
Configuring a Machine Type KPI
name (required): Raw field name for the KPI.
display_name (required): Display name for the KPI shown in the UI.
formula (required): Mathematical expression to calculate the KPI.
dependencies (required): List of objects specifying aggregate functions for the variables in the formula, which must have the same name.
name: Variable name as it will be referenced in the formula
aggregate: Aggregate function for the variable. It must be one of sum, min, max, avg.
field_maps (required): List of objects mapping KPI dependencies to actual database column names.
alias_map (required): Object mapping each dependency, using the name defined for it, to the raw field name. Multiple mappings are only required if different machine types map to dependencies differently
name (required): Raw field name (you can user Field Explorer to find this string)
machine (required): Specific machine used for this KPI field. Each machine will have the KPI available to them
row_formula (optional): Applies per-row, pre-aggregation transformations to the KPI's dependencies--uses the same syntax as runtime fields.
machine_types (required): List of machine types used in the KPI calculation.
unit (optional): Unit of measure for the KPI (e.g., %, pounds).
directionality (optional): Indicates if higher values are better ("positive") or lower values are better ("negative").
good_threshold (optional): Threshold above which the KPI is considered "good".
bad_threshold (optional): Threshold below which the KPI is considered "bad".
Restrictions on a Line KPI
Line KPIs are only available within the Line model and are not currently supported on the Homepage or applications that do not support the Line model (such as the Single Value Widget).
Within the field_maps, Line KPIs require a single
machineto be specified for each dependency. This is the machine from which that dependency's data will be retrieved.Line KPIs are automatically available to all machines used to calculate it, and the value is the same independently of which machine is selected to display it.
Line KPI Example
{
"name": "KPI_internal_name",
"display_name": "KPI display name",
"formula": "100*kpi field name 1/(kpi field name 1 + kpi field name 2) if (kpi field name 1 + kpi field name 2) > 0 else 0",
"dependencies": [
{
"aggregate": "sum",
"name": "kpi field name 1" // First KPI field name
},
{
"aggregate": "sum",
"name": "kpi field name 2" // Second KPI field name
}
],
"field_maps": [
{
"alias_map": {
"kpi field name 1": {
"machine": "Machine 1", // Specific machine used for this kpi field
"machine_type": "Machine Type 1", // Machine type of the machine used for this kpi field
"name": "stats__field_for_kpi_field_1__val"
},
"kpi field name 2": {
"machine": "Machine 2", // Specific machine used for this kpi field
"machine_type": "Machine Type 2", // Machine type of the machine used for this kpi field
"name": "stats__field_for_kpi_field_2__val"
}
},
"machine_types": [ // List of all machine types used in the KPI calculation
"Machine Type 2",
"Machine Type 1"
]
}
],
"unit": "%", // Used for color-coding on homepage
"directionality": "positive", // 'positive' means higher is better. 'negative' means lower is better.
"good_threshold": 80, // Threshold at which the KPI is "good"
"bad_threshold": 60 // Threshold at which the KPI is "bad"
}Note: The comments, delineated by
//, are not considered valid JSON and you should remove them when configuring your KPI.
Creating KPIs
This guide explains how to create your first KPI.
Step 1: Navigate to the navigation bar and select Create New.

Step 2: This action leads to the edit page where it's possible to create the KPI.

Step 3: Update the JSON editor with all the parameters for the new Machine Type KPI. The given example calculates the percentage of planned downtime.

Step 4: After entering all necessary parameters, select Create to generate and activate the KPI.

Updating KPIs
This guide explains how to update your KPIs.
Step 1: Select the KPI to update.

Step 2: Navigate to the draft view.


Step 3: Implement the desired changes. For instance, adjust the threshold to 90.

Step 4: After ensuring no errors and approving the changes, click on Reactivate to apply these changes to the KPI.

Step 5: Confirm that the changes are now active.

Deactivating KPIs
This guide explains how to deactivate your KPIs.
Step 1: Select the active KPI for deactivation.

Step 2: Navigate to the edit page.

Step 3: Click on Deactivate.

Step 4: After successful deactivation, the KPI's status changes to 'inactive'. Confirm the status change to 'inactive'.

Step 5: Return to the previous page and check the KPI's status. It should now display as 'inactive'.

Deleting KPIs
This guide explains how to delete your KPIs.
Step 1: In order to delete a KPI, you must ensure that the KPI is inactive. If it not go you will have top deactivate it first use the previous guide


Step 2: Once the KPI is inactive, click on the Options menu and select Delete


Step 4: Confirm the deletion. After confirming, the KPI is successfully removed.

Reverting KPIs
This guide explains how to revert your KPIs back to their active version
Step 1: Start by editing the KPI that needs changes.

Step 2: If during the modification process, it's decided not to retain the changes, proceed to the next step.


Step 3: Navigate to the Options menu and select Revert to Active.


Step 4: Confirm the action by clicking on Accept.

Upon completion of these steps, all changes get discarded, and the draft version syncs with the active version.