Single Value Widgets let you visualize KPI data or process parameter values on dashboards. The data displayed can be an aggregated value, or the current value of a data field in real-time. These widgets are really useful when creating dashboards for the plant floor, where critical parameters are monitored in real-time.
To add a Single Value Widget to a Dashboard, go to Options > Add New Widget, and then select Single Value.
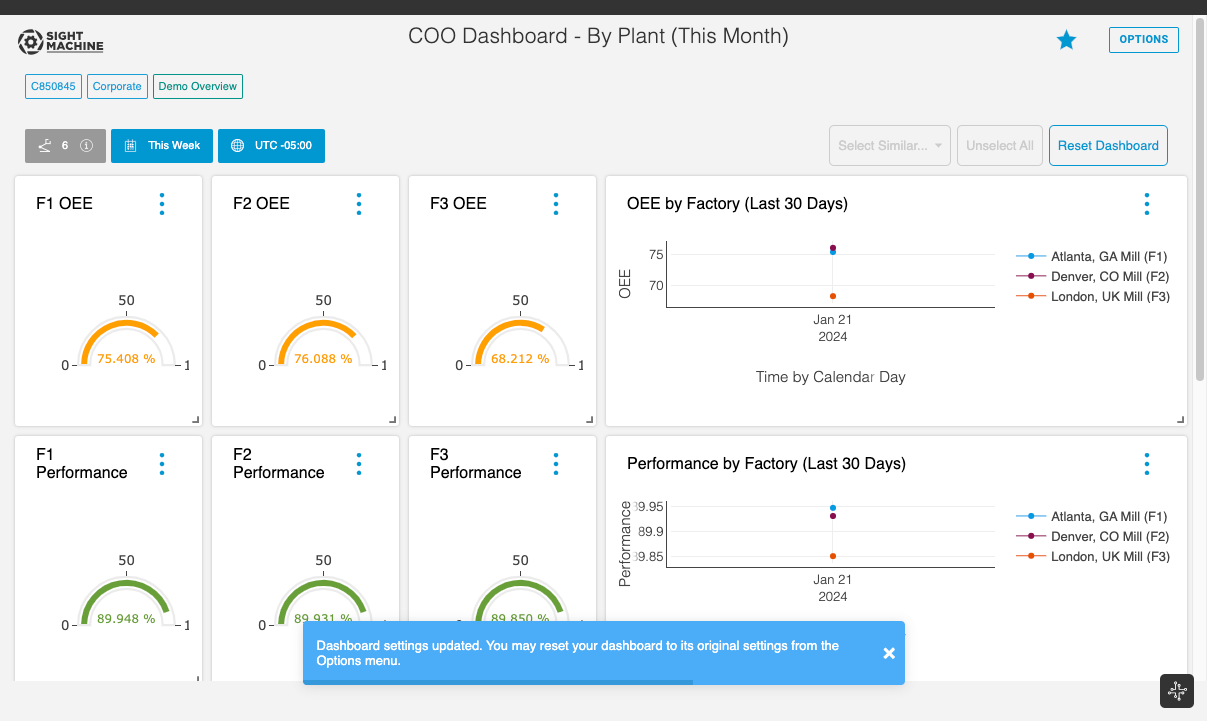
Single Value Widgets have display options of Big Text, Gauge, and Progress Bar.
In this example, Single Value Widgets of type Gauge show OEE data across facilities in a multi-facility plant.

Modifying Time Units
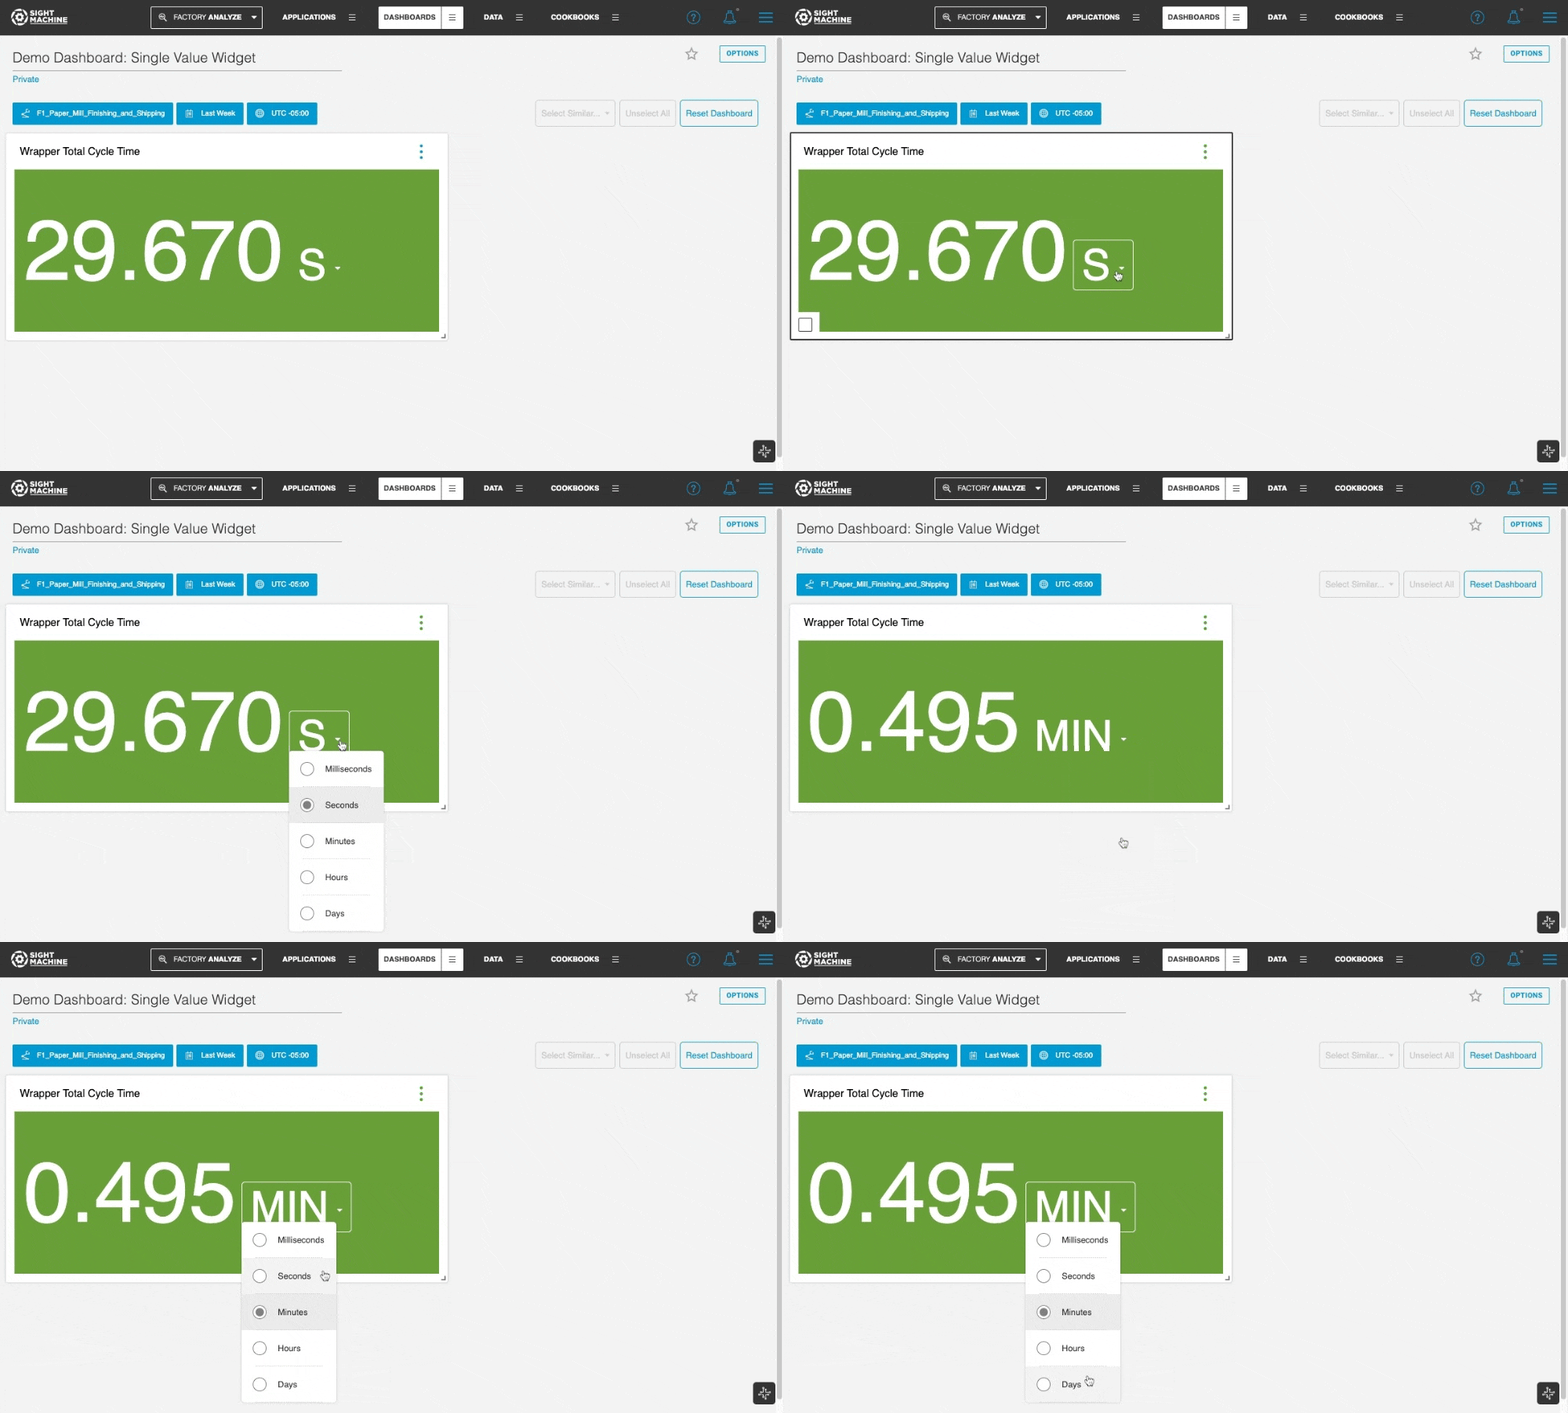
Single Value Widgets displaying data fields with time units now have an additional option where users can modify the units displayed. You can use the drop-down selector on the time units and choose from units of milliseconds, seconds, minutes, hours, and days.
The unit selected to be displayed (e.g. seconds) persists for all viewers of the dashboard, when the dashboard owner modifies the dashboard. In addition, users can override the default unit selected and have their selection persist for their next view of the dashboard.

Data Models Support
The Single Value Widget provides support for Data Fields from the Cycles, Parts, and KPI Data Models.
.gif)