Page link allows users to navigate from one app page to another by selecting the links within the visualization.
Terminology
Visualization: Refers to both charts and tables.
Origin Page: The page linking from.
Destination Page: The page linking to.
Picker: Input selection i.e. date picker to select date range.
Sidebar: The container for the list of pickers.
Basic Concept
A link to the destination page is essentially two steps:
We navigate the browser to the destination page.
We populate the destination page's sidebar pickers with parameters we wish to pass on (i.e the selected dates)
With this in mind, here is the structure of a link. In this example we are mapping from page app_p1 to page app_p2 by selecting a table row.
{
    'page_id': 'app_p2',
    'mapping': {
        'asset': 'asset',
        'dateRange': "{mode: 'absolute', startDate: row['Cycle Start Time'], endDate: row['Cycle End Time'] }",
        'filter_1': 'filter_1'
    },
}
The
'page_id': 'app_p2'indicates the destination page id.In the
mapping, we declare we want the pickers inapp_p2to be populated with these parameters. Pickers inapp_p2not in this mapping will be populated with their own default parameters.The key in
mappingrefers to thepicker_idon the destination page.Here we have
asset,dateRangeandfilter_1picker ids.
The
valueinmappingare the values we want the destination pickers to receive.When the value is just a string, we map the origin picker to the destination picker directly. Here, the
assetpicker and any filters created with filter_1 will directly pass on to theapp_p2sidebar.When the value is an object, we evaluate the object string template and populate the destination picker with the values specified. Here, the
dateRangepicker is changed toabsolute modeand populated with the selected row'sCycle Start TimeandCycle End Time.
Picker Page Link
To see specific page link formatting for each picker type, see the picker's documentation.
Visualization
The same linking mapping structure can be applied to different access points depending on the visualization type.
MUI Datagrid
"viz_type": "mui-datagrid"
Row Page Link ("row_page_link")
Selecting a row will link to the destination page.
{
    "id": "main-table",
    "viz_type": "mui-datagrid",
    "viz_props": {
        "tableData": {
            "rows": rows,
            "columns": columns,
            "row_page_link": link_mapping
        }
    }
}
The mapping will have access to the entire row object for the selected row. For example if the rows array is:
"rows": [
  {
    "index": 0,
    "Cycle Start Time": "2024-11-19T05:00:00Z",
    "Cycle End Time": "2024-11-19T05:00:30Z",
    "Shift": "Crew B",
    "Machine": "F1_Paper_Mill_Finishing_and_Shipping",
    "id": 0
  }
]
in the mapping 'dateRange': "{mode: 'absolute', startDate: row['Cycle Start Time'], endDate: row['Cycle End Time'] }" the startDate and endDate will be parsed to include the selected date.
TIP
You can add extra fields to the
rowsobject and not include them in thecolumnssetup as a way to pass extra metadata you may need in the link mapping.
Column Page Link ("column_page_link")
Selecting a specific column will link to the destination page. The column with column_page_link will be styled with blue link text.
  "columns": [
    {
        "field": "Cycle Start Time",
        "headerName": "Cycle Start Time",
        "type": "datetime",
        "column_page_link": {
        "page_id": "app_p2",
        "mapping": {
            "asset": "asset",
            "dateRange": "{mode: 'absolute', startDate: row['Cycle Start Time'], endDate: row['Cycle End Time'] }",
            "filter_1": "filter_1"
        }
      }
    },
    ...
  ]
The mapping will also have the entire row object of the selected cell. Additionally, it will also have the field string which is the selected cell's column title. For example, if we select a cell in the Cycle Start Time column field = "Cycle Start Time".
Plotly Chart
"viz_type": "plotly"
Page Link
To add a page link to any plotly chart, in the "viz_prop" object add a new key "page_link" with a value of an array of page_link mappings. When the user select a point/bar/slice of the chart a menu will show up with option to select the link.
For example:
 "viz_props": {
    "data":...,
    "layout":...,
    "page_link": [{
        "page_id": "app_p1",
        "mapping": {
            "asset": "asset",
            "dateRange": "dateRange",
            "filter_1": "filter_1"
        },
        "title": "Link to App 1"
    },
    {
      "page_id": "app_p2",
      "mapping": {
        "asset": "asset",
        "dateRange": "dateRange",
        "filter_1": "filter_1"
      }
    }
  ]
 }
This example will create a menu with two items to two different pages. "title" is an optional field to specified the menu item title. By default the destination page's display name will be shown.
Clicked Point
Instead of row, plotly page linking has access to point object which corresponds to the point the user selects. An example of this would be:
{
    "point": {
        "x": 2025,
        "y": 600,
    }
}
To get more information on the available data in the point, go to the app preview mode and open the developer console. Select a point on the chart and point will be logged in the console.
Clicked Point Menu Title
Instead of specifying the menu item title when a point is selected, the title_path option allows you to specify the property path to use as the title. For example:
link_mapping = {
'title_path': 'data.name',
'page_id': 'sample_app_bar_chart',
'mapping': {
...
}
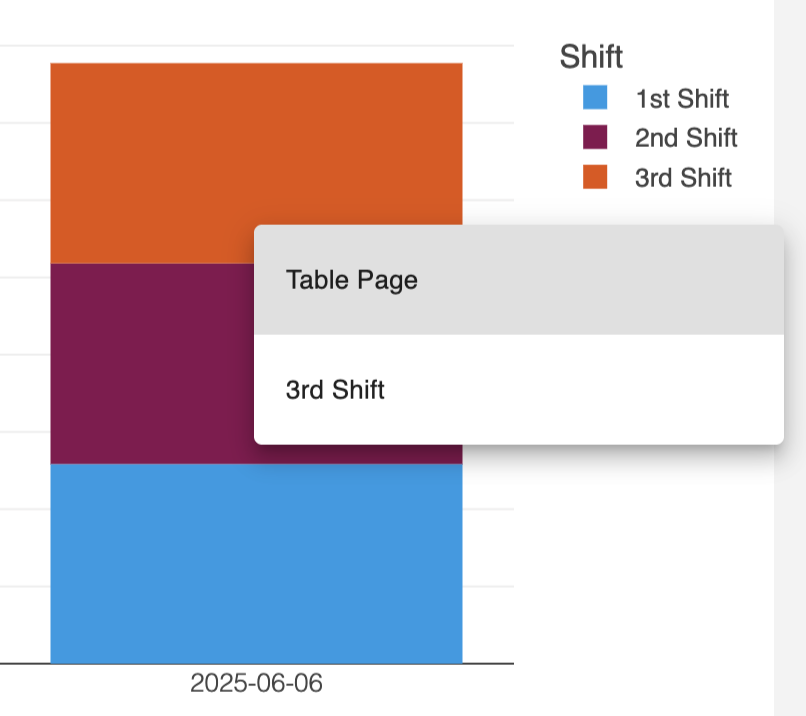
}This will use point.data.name as the title of the menu item. So if the point selected has data.name = "3rd Shift" the menu will look like this:
Markdown
"viz_type": "markdown"
data-link
To add page linking for any element in a markdown panel (i.e. text), we wrap the element in a special <span data-link></span> and utilize the utility function from sm_udf.app_builder.util import create_markdown_encoded_data_link.
For example:
from sm_udf.app_builder.util import create_markdown_encoded_data_link

link_encoded = create_markdown_encoded_data_link(link_mapping)
markdown = f"""
<span data-link="{link_encoded}">View Chart</span>
"""

markdown_panel = {
    "id": "markdown-panel",
    "viz_type": "markdown",
    "viz_props": {
        "markdown": markdown
    }
}
The above will create a link with the text View Chart that when selected, will link to the corresponding link_mapping.
Update Self
In cases where you want selecting a point or item in the data table to update the current page's sidebar, you can use the update_self property. Setting 'update_self': True in a link will direct the mapping to the current page's sidebar (instead of linking to another page).
For example:
link_mapping_self = {
    'title_path': 'data.name',
    'update_self': True,
    'mapping': {
        'shift_picker': '[point.data.name]',
    }
}
This mapping will update the page's own shift_picker picker with the selected point. Note the page_id property is no longer needed. The mapping logics/features remain the same as linking to another page.
Here's a demo:
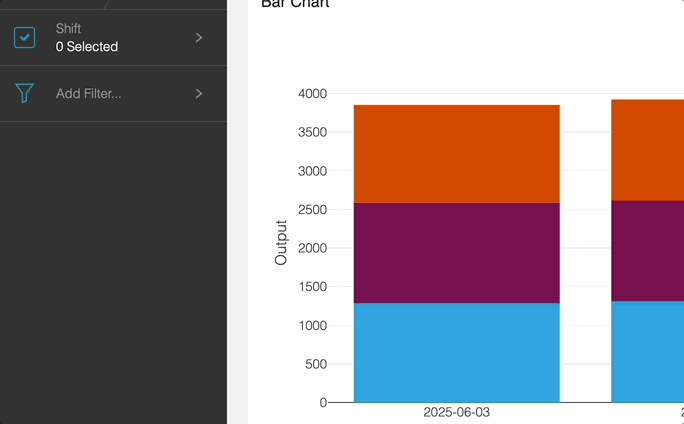
The shift picker is updated with the selected data point.