Overview
Process Variability Tools help manufacturers identify, analyze, and reduce variability in production processes. By understanding variability, teams can improve consistency, optimize quality, and enhance operational efficiency.
Key Features
Root Cause Analysis
- Detect sources of variability across machines, lines, and shifts.
- Pinpoint patterns that affect product quality and throughput.
Statistical Process Control (SPC)
- Monitor process stability using control charts and variability metrics.
- Identify deviations from standard operating conditions in real time.
Data Visualization
- Interactive dashboards for comparing variability across time, regions, or equipment.
- Visual tools like histograms, Pareto charts, and scatter plots for deeper insights.
Correlation & Impact Analysis
- Understand relationships between process parameters and variability.
- Quantify how changes in inputs affect outputs.
Alerts & Recommendations
- Automated alerts for abnormal variability trends.
- Actionable insights to guide corrective measures.
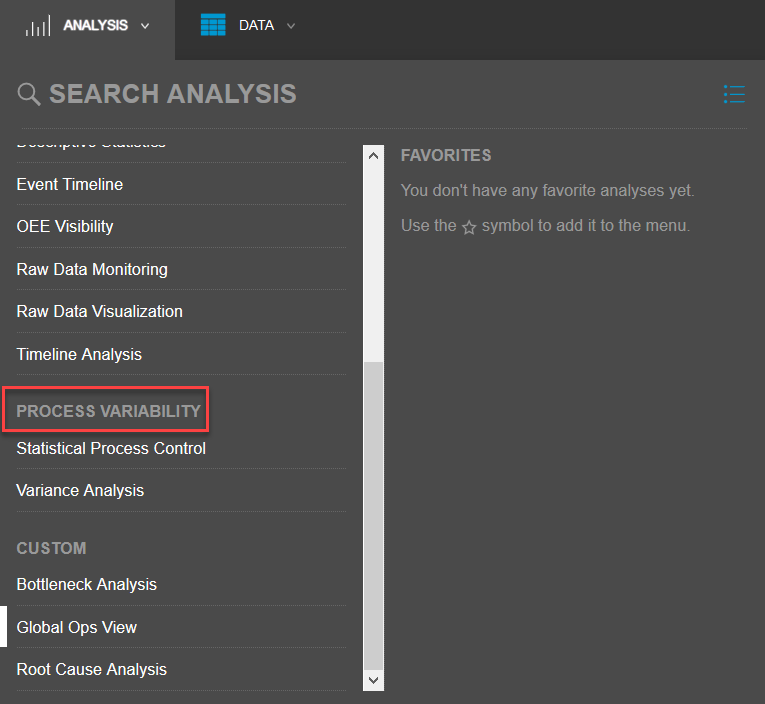
The following two tools are on the Analysis tab, under Process Variability, are focused on your organization's processes:
Sight Machine’s SPC and Variance Analysis tools are designed to help manufacturers monitor process stability, identify sources of variation, and drive continuous improvement. When opening either tool for the first time, users should follow these initial steps to ensure accurate setup and meaningful insights:
Step 1: Select Your Data Source
Choose the production line, machine, or process dataset you want to analyze.
Ensure the dataset includes the relevant time range and variables (e.g., cycle time, temperature, pressure, or quality metrics).
Confirm that the data is clean and complete to avoid misleading results.
Step 2: Define Key Parameters
For SPC, specify the measurement variable and subgrouping (e.g., by batch, shift, or time interval).
For Variance Analysis, select the dependent variable and the factors you want to compare (e.g., machine vs. operator, material lot vs. product type).
Adjust filters to narrow down the scope of analysis to the most critical process segments.
Step 3: Configure Visualization Settings
Choose the chart type appropriate for your analysis:
SPC: Control charts (X-bar, R, or Individuals charts).
Variance Analysis: Variance contribution plots or factor comparison charts.
Set thresholds, control limits, or confidence intervals as needed.
Apply labeling and formatting options to make the charts easier to interpret and share.