After you save your newly created widget, it appears on your dashboard. You can add multiple widgets to each dashboard.
Dashboard widgets have several options, accessed via the overflow menu (three dots on the top right):
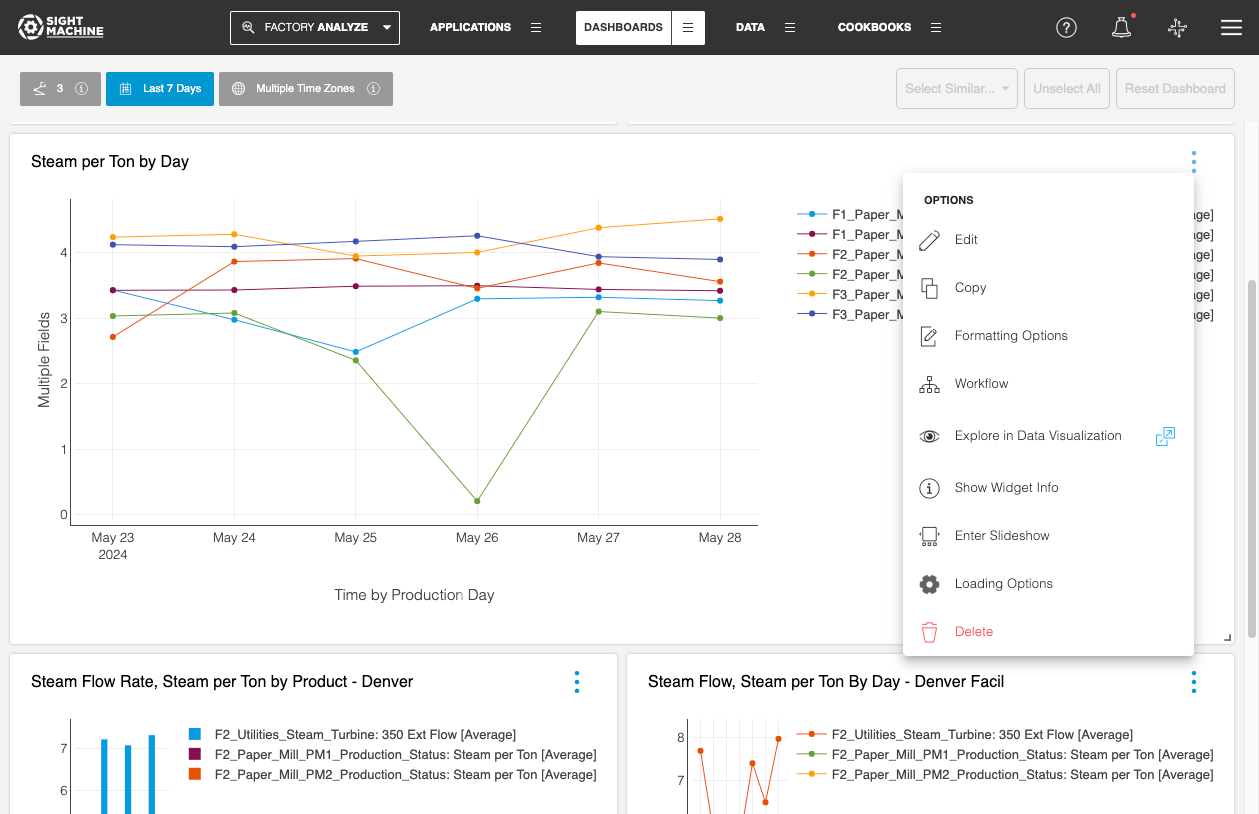
1. Edit: The Edit option allows in-place editing and updates the parameters saved within the widget on the dashboard.
2. Copy: Create a copy of the widget, and save it to the current dashboard, another existing dashboard, or a new dashboard. Clicking on Copy automatically opens a copy of the widget in editing mode, and allows you to make changes to the copy. For example, you can build a widget that visualizes data from one machine, and then create a copy for each other machine of the same type, or for the same machine and a different date range.
3. Formatting Options: Control the appearance of the widget on the dashboard with options to modify font sizes of text elements, show or display data labels, specify decimal place settings for data values, adjust margins for charts, and other options. Please refer to the Formatting Options for Dashboards section for more details.
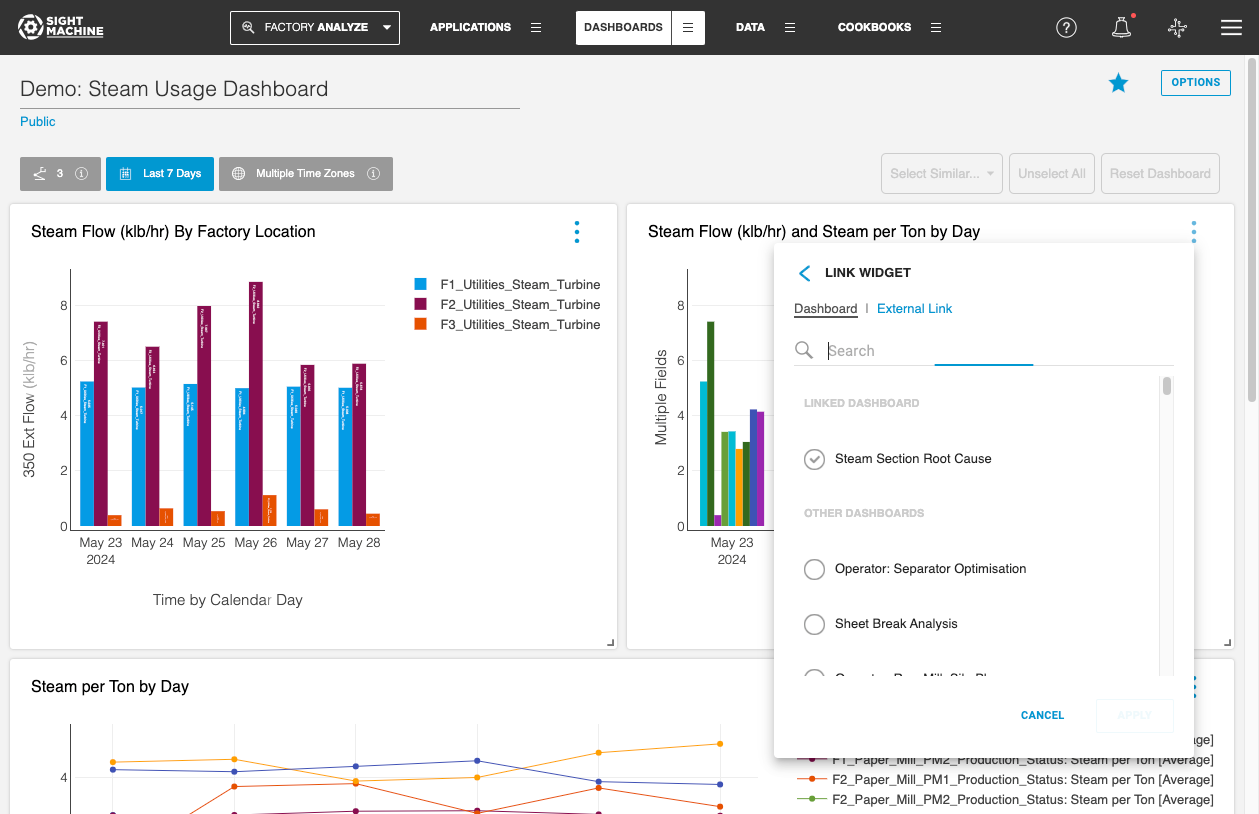
4. Workflow: Add links from the current widget to an existing dashboard or an external URL to create a workflow. This capability can be very useful to navigate related widgets across dashboards. For example, a series of visualizations and analysis can be linked together to demonstrate a process workflow that flows from visualization to issue identification and root cause analysis. Workflows can also be useful for linking to useful information such as documentation for the process being analyzed, SLAs, and help documentation.
5. Explore in ...: The Explore In option on every Application enables you to modify your visualizations or analysis (for example, Explore in Data Visualization or Explore in Time-Series Correlation), without modifying the original widget settings on the dashboard. This capability is useful when you want to visualize additional fields, add Compare By options, view data over a different time range, or try out other filter settings to understand your data better.
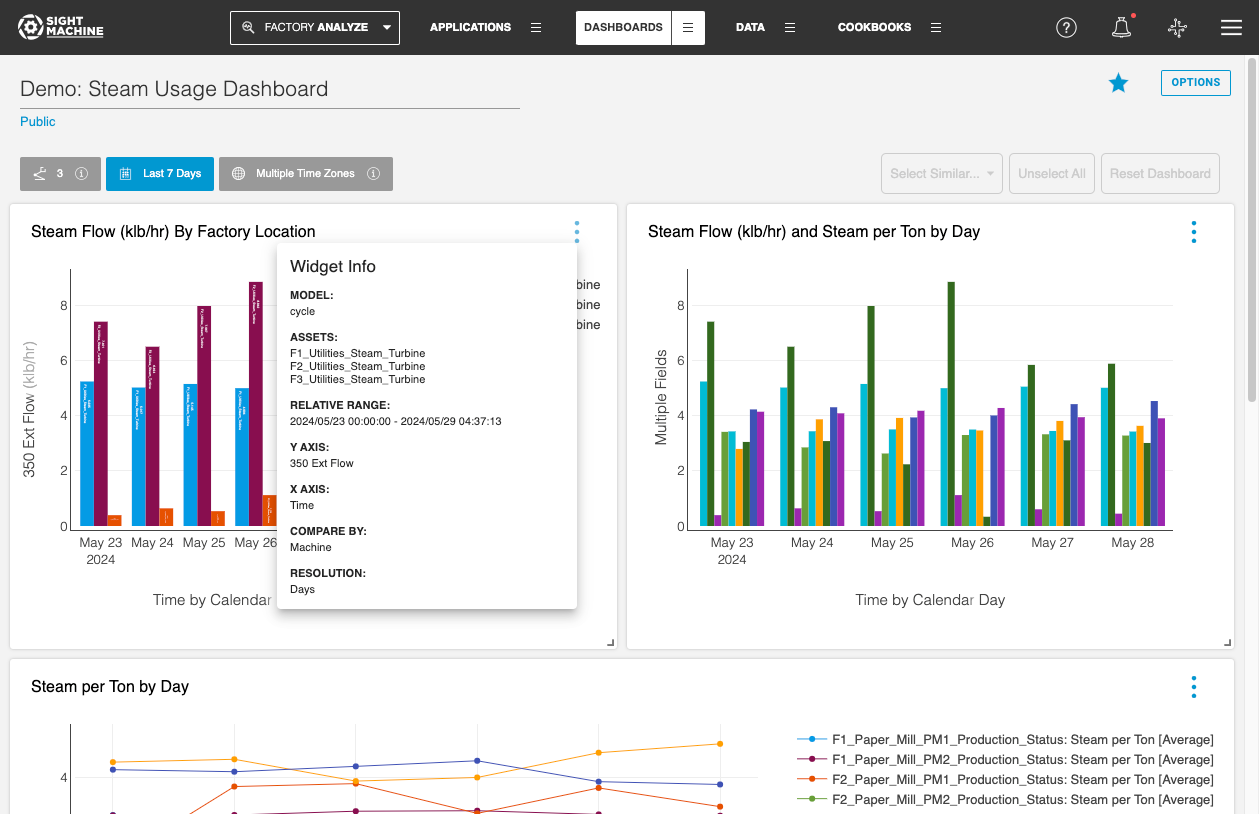
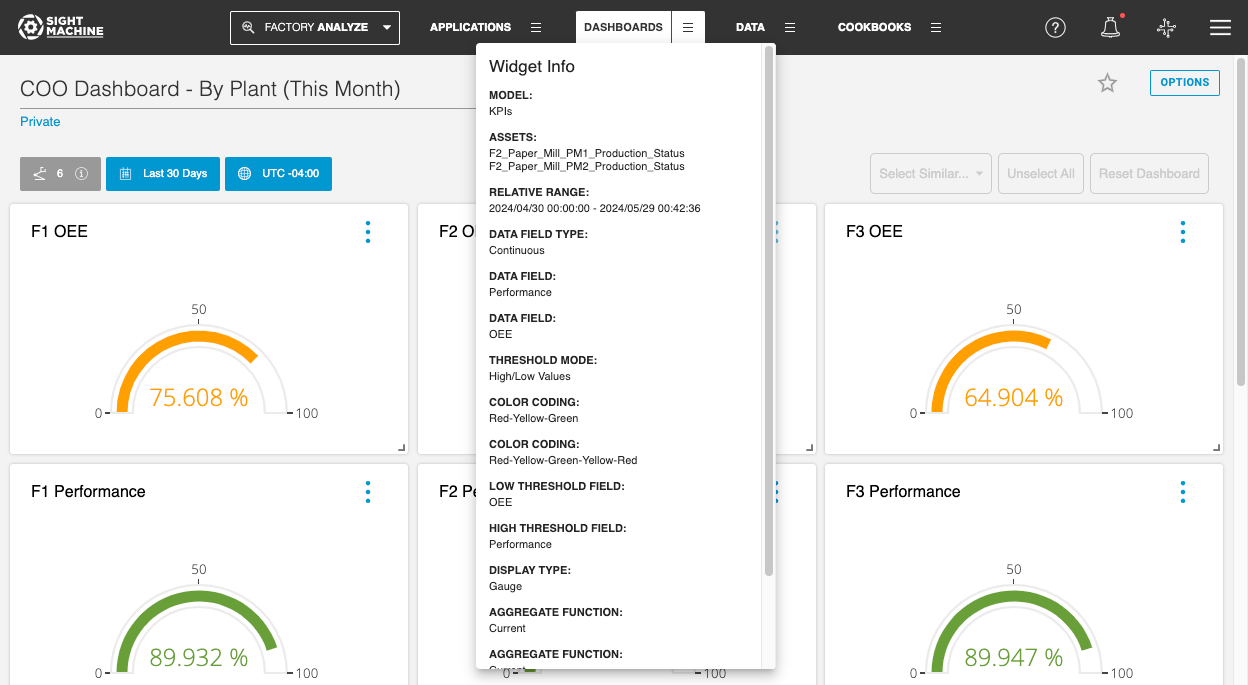
6. Show Widget Info: This option enables you to view parameters such as Data Model, Asset, Time Range, Data Field, and Filter selections selected in the widget, without having to load the data, like you do in Edit or Explore In views. Several additional parameters are also displayed, such as X-axis and Compare By selections, as well as X-axis time resolution.
7. Enter Slideshow: This option enables you to launch a slideshow of all the widgets on your dashboard, beginning with the widget on which you select this option.
8. Loading Options: This option allows you to enable the selected widget to run in the background for improved dashboard performance. Please refer to the Background Loading for Widgets section for more details.
9. Delete: Remove the widget from your dashboard.